There’s been another eruption of discussion on Engagement. If (like me) you’re more interested in the higher level ideas not so oriented towards the “tool” aspects of this discussion, make sure you catch this post and hefty comments. For more, also here, here, and here.
At a high level, there really are 2 kinds of Engagement, and I think it would be helpful for us to start differentiating between them.
One is “intra visit” Engagement, which as far as I can tell is really mostly relevant to the world of Advertising. Some action or series of actions indicates the visitor is “engaged” with the site or the Brand. In this model, whether the visitor comes back or not is not particularly important to the Advertiser, as far as I can tell (it still may be important to the Publisher). But as long as people find value in “impressions”, then the issue of the visitor coming back or not seems to be irrelevant. And so this type of engagement is really nothing new; it is simply the accounting of a variety of “past actions”, though perhaps in more complex ways.
The other kind of Engagement, the one the matters when your business model thrives on repeat business or visits, is the more complex idea for web analytics, because it involves measurement of activity that “has not happened” – a neat trick if your analytics app depends solely on parsing “requests”. What you need to know is which visitors or customers “did not request”, and optimally, how long it has been since they last requested.
If you think about it, this is quite similar to the idea of separating the analysis of New versus Returning Visitors, which is as old as cookies. Many folks think this kind of analysis is important, because Repeat users tend to behave differently than New users. The difference between New / Returning and the second form of Engagement is this: you are also looking at who is not repeating, not returning.
In other words, you are measuring Friction, and looking for ways to reduce it. Just like one looks for ways to reduce Bounce rate.
Friction is the force that causes the opposite of Engagement; it’s the reason Engagement ends, causes dis-Engagement. Friction is really about the likelihood a customer will continue to do business with you.
The actual causes of Friction are created on the business side, and manifest themselves on the customer side as impatience, frustration, and finally lack of loyalty.
Customers encounter varying degrees of this Friction in their business relationships, and become more or less likely to do business with you as this Friction changes. They already have low tolerance for poor customer service, processes that don’t work as they should, pricing that changes unexpectedly or is confusing, interfaces that make it difficult to accomplish tasks, communications that are sloppy, not delivered in a timely way, or irrelevant.
All of these Friction points tend to create increasing levels of frustration and ill will, which over time mutate into dissatisfaction and defection. Friction accumulates to the point the customer simply decides to start seeking alternatives, and once alternatives are found, the customer terminates the prior business relationship.
This may not sound new to you, but here is something that might be. The Friction effect is especially true and is more pronounced as “customer control” of the business relationship increases. All the talk about “customer experience management”, which usually lacks any kind of effective and rational measurement system, is fundamentally a discussion about Friction. And you can measure Friction.
Customers are demanding and taking more control of business relationships themselves, as is true with web retail, or have been forced to take control, as with the practice of pushing customers to serve themselves though the web or a telephone interface. As the ability for the customer to exert control in the business relationship increases, customers become less and less tolerant of Friction.
And, as Friction rises, the customer becomes less and less likely to do business with you in the future. If a customer is becoming less and less likely to do business with you, the value you could realize from the business relationship with the customer in the future has to be falling.
In other words:
Rising Friction = falling Potential Value;
Falling Friction = rising Potential Value
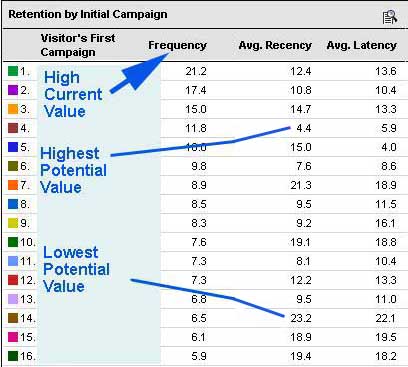
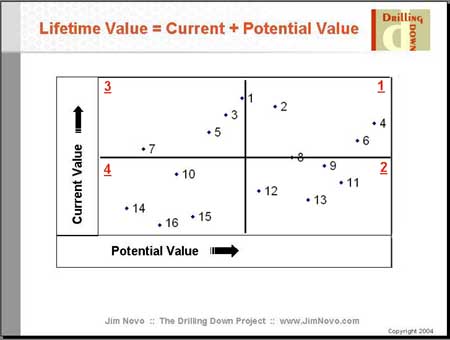
So, if you can measure Friction, you can measure Potential Value, the value of visitors or customers in the Future. By any segment: the Campaign they came from, the Products they buy, the Content they visit. And, by comparing them, you can re-allocate budget away from Campaigns, Products, and Content that create low Potential Value towards Campaigns, Products, and Content that create high Potential Value. You can literally map Friction across the visitor / customer base:
Measuring Friction is exactly what LifeCycle Metrics like Recency and Latency do. By measuring Friction, these metrics also measure the likelihood of a customer to do business with you in the future, and so also measure the Potential Value of the customer.
Visitors and customers will “signal” their Friction levels through their own behavior; LifeCycle Metrics organize and codify this behavioral data for you, and allow you to create reports and trip wires that flag increasing or decreasing Friction.
And how do you reduce Friction? By applying the grease – your innovative selling and service campaigns are the grease that will hopefully reduce Friction and increase the Potential Value of the customer. Fortunately, you will have your LifeCycle Metrics to tell you precisely who needs the grease, when it should be applied, and even when it should be applied a second time.
These Potential Value metrics will also tell you when your relationship with the customer has already “seized up” and it’s too late for the grease. You only have so much grease and the grease is expensive, so you want to apply it only when and where you think it is likely you can reduce Friction and prevent the relationship from seizing up.
By the way, customers are not the only folks who experience Friction, people trying to become customers experience it also. An easy way to measure this want-to-be-a-customer Friction is to look at the visitor conversion rate on your web site, or the opposite – Bounce Rate.
Navigational design and layout determine “physical” Friction and copy elements determine “emotional” Friction. Design and layout testing will reduce physical Friction; persuasive copywriting will reduce emotional Friction. Success at reducing want-to-be-a-customer Friction is measured by an increased rate of visitor conversion to goal on the web site and offline as well.
It is measuring and Acting on Friction that makes this second form of Engagement truly a new thing. It brings web analytics into the world of Prediction rather than being always backwards-looking, which is what you need to get the C-Level to really pay attention. This approach also pushes the analysis into customer service, tools / products, policies, and all kinds of other areas.
You can see an example of reducing Marketing (Packaging) Friction here. And example of reducing Operational (Payment Processing) Friction is here. Both were discovered by simple customer analysis; both impact how successful Marketing programs were. There’s a ton of this kind of thing laying around your company.
Will you do anything about them? Or are these issues “not your job”?
As an analyst, when you can show (examples) Campaigns, Visitors, and Customers are experiencing Friction, that they are literally being pushed away by specific Products, Content, Sales People, Service Agents, and Policies, you will be embracing the full potential of what visitor and customer analytics has to offer across the enterprise.
2 thoughts on “Friction Model”