The Measuring Engagement series starts here. For a clickable index of the 5 part Measuring Engagement series, look here.
OK, now that you have (way too much?) background, let’s get to the “how to” on this Recency / Engagement stuff.
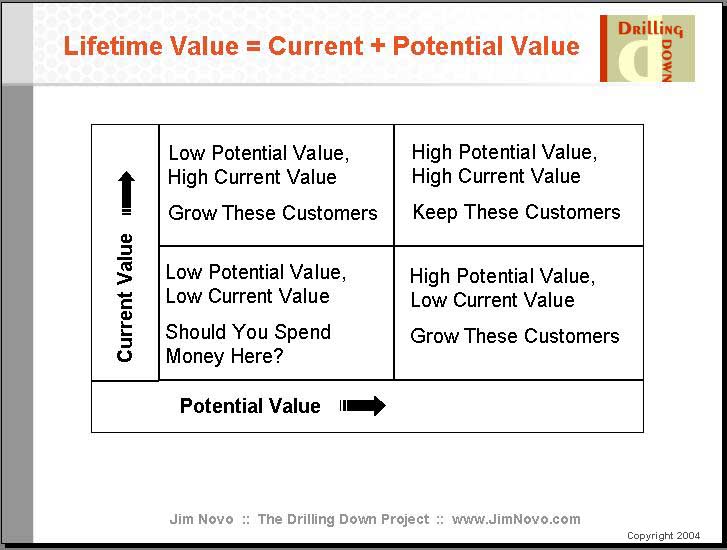
Recall that you can plot value-creating visitor / customer actions on a common platform and create a “customer engagement map”. Decide what visitor variable or action representing value to the firm you want to map – this is Current Value. Number of Blog posts or Comments, Visits, purchases, page views, visits to a certain content area, sign-ups for a newsletter, opens, clicks, you name it – any action that either creates value directly or represents value to to the firm.
Then take a look at how Recent the visitors or segments are in terms of accomplishing the action; this is Potential Value (if you’re not following this reasoning, see here). Plot Current Value and Potential Value of each segment and you have a very easy to understand “map” of where you are – and where you could go – in terms of increasing customer value / engagement. Each quadrant of the map has a general marketing objective in terms of allocating resources – Keep the Customer, Grow the Customer, Question Spend on the Customer.
Why should you do this kind of mapping? Two reasons – consistency and repeatability.
Consistency, meaning the world of web analytics is messy enough and you want to introduce some rigor to the thought process and decision making when looking at various aspects of optimizing visitor / customer value. Having a simple model to compare the various aspects of engagement ensures a level playing field for all – including the comparison of offline and online efforts. This is not a web only model; it works in the “real world” as well.
Repeatability, meaning Recency is an incredibly stable behavioral metric that delivers time and time again, in the exact same way, over and over. You can bet your marketing or operational dollar with confidence every time on Recency. The more Recently a segment has accomplished any of your goals from above, the more likely they are to accomplish that goal again – either by themselves or due to stimulation on your part.
Let’s take a look at what this looks like with Campaign data. Here we have a series of new campaigns that all started at the same time (Campaign names have been blanked out to protect the client) with Frequency of Visit data as the Current Value and Average Recency of Visit in each Campaign as Potential Value. In this case, we are looking at the First or Initial Campaign the visitor was exposed to:

For this web site, Visits are the action that generates value for the firm. These 16 Campaigns are sorted by Frequency of Visit – the Current Value of visitors generated by each Campaign. The second value is the Average Recency of visitors from that Campaign – the Potential Value of the Campaign. You can see that Campaign 4 generates visitors with High Frequency and very Low Recency – this Campaign is generating Visitors that not only add value to the firm, but are highly likely to add value in the future. In other words, they are both high value and engaged.
What would these campaigns look like on the Current Value / Potential Value map? Glad you asked; here they are ranked on a relative basis to each other:
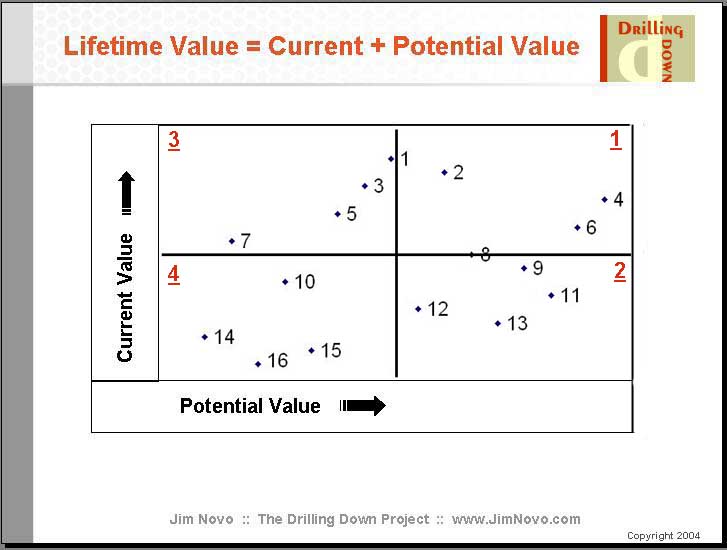
Since the ID numbers 1 – 16 for the campaigns were sorted by Frequency / Current Value to begin with, campaign ranking on Current Value starts at the top of the chart and falls to the bottom. Potential Value grows as you move from left to the right. Each Quadrant has a red underlined number ranking the relative desirability of investing more capital in the campaigns from that Quadrant.
In Quadrant 1, we have the “rocket fuel” campaigns. These campaigns are generating visitors who both keep coming back Frequently and are Engaged – visitors with high value to the firm now and in the future. These visitors are likely in the “20% of visitors generating 80% of visits” component of the visitor base. In Quadrant 4, you have campaigns generating visitors who don’t have much value now and won’t have much value in the future. In general, you want to reallocate spend on Campaigns in Quadrant 4 towards spend on Campaigns in Quadrant 1. This will optimize your Campaign throughput and longer term ROMI; you want to “gun” Campaigns 2, 4 and 6.
In Quadrant 2 we have campaigns that don’t generate a lot of Current Value but have high Potential Value; these visitors are “potential up and comers”. Please note: due to the lower Frequency / Current Value, people often kill these Campaigns before they have a chance to blossom. This is usually a very bad idea and often can gut the profitability of the overall effort. The Recency / Potential Value component tells you these visitors are engaged; they simply have not delivered much Current Value so far; if at all possible, let these campaigns run.
In Quadrant 3 we have the “early bloomers”; high Current Value and low Potential Value. Ironically, these are the campaigns people tend to invest more money in due to the early activity, often robbing from Campaigns in Quadrant 2. This can be misguided, depending on what your end objective is. If you want to build an engaged visitor base, this is not the place to invest. If you just want to generate short-term “activity”, then these are the campaigns you want.
But budget allocation isn’t the only thing going on here. Knowing how these campaigns are mapping across the visitor value grid, you want to ask yourself these additional questions:
1. What is similar about campaigns in Quadrants 1 & 2 that is different from Campaigns in Quadrants 3 & 4? In other words, what is it that generates engaged visitors with high Potential Value? Is it campaign media, copy, offer, channel, product, content area of the site they are sent to? What are the drivers of this behavior?
2. What is similar about campaigns in Quadrants 1 & 3 that is different from Campaigns in Quadrants 2 & 4? In other words, what is it that generates high Frequency visitors with high Current Value? Is it campaign media, copy, offer, channel, product, content area of the site they are sent to? What are the drivers of this behavior?
This is where the ideas of Consistency and Repeatability driven by the Current Value / Potential Value platform come into play. If you can distill why certain campaigns generate visitors that end up in each Quandrant, you can:
1. Rely on the same campaigns to generate visitors that will always land in a certain Quadrant – you get results that are Consistent instead of wondering why things happen the way they do, which often is the case when using segmentation based on demographics, product affinity, etc. Behavior predicts Behavior, as long as you are tracking actual behavior.
2. Know that when you take these drivers of behavior out of the current campaigns and create new campaigns, your results should be as expected. You will be able to Repeat your success in other types of campaigns as well as in related ideas like web site copy, landing page copy, merchandising, and so forth.
You can also use these drivers to tweak and improve the behavioral performance of campaigns like 1, 3, 8, and 9, eventually moving them from borderline to solidly into Quadrant 1.
Are you with me?
For those of you looking to integrate online data with offline, let me suggest that a simple “Quadrant Tag” of 1 – 4 for a customer would contain a ton of actionable data about the web behavior of that customer in a very small space. You could create a “Master Tag” for the most important web KPI or export a series of Quadrant Tags for a variety of KPI’s. There really is no need to send a lot of detail to CRM if you can send only the most actionable keys, which can be used for trigger-based responses in either campaign automation or call center scripts. There is no better high-level summary of a customer’s web activity than a single digit that represents the Current and Potential Value of the customer on the web.
By the way, this model generally tracks with the valuation model folks on Wall Street use to value direct and database marketing companies. Wall Street wants to know two things in this area: how much have customers spent, and how Recently did they spend it?
This is why you so often hear metrics like “12 month Active Customers” used to describe Amazon or eBay. Investors want to know not only the Current Value of the customer base, but also the Potential Value. The 12-month model is a bit “slow” for my tastes, especially when you are talking about the web. It’s much better to use the raw Recency stats to build out the Value Model above and find out exactly what the heck is going on.
You know anybody that makes online campaign decisions based on a 12-month test window?
Recency is in fact a very simple, single variable, predictive model. I’ll bet you any money if you go out and create a complex, multi-variate regression model for predicting “likelihood to repeat action” that Recency will be in there right at the top. Not to say those more complex models are not valuable, you know; they are – as long as you have the capability to execute on them. But Recency by itself is very powerful and you can use it right now, both online and offline, to measure engagement and optimize the Potential Value of your customer base.
As always. your comments and questions on the above are appreciated! In the near future, we’ll look at more applications beyond Campaigns for using the very same mapping of Current and Potential Value for Visitors and Customers.
The next post in this series on Measuring Engagement is here.
Do you find that a lot of businesses are good at this type of stuff?
If not, how do you evangelize these concepts with the folks you work with?
Just curious. Keep up the good work!
Kevin.
Hi Kevin,
A lot of them? No, probably not, not yet anyway. But many are working on these concepts at some level. Often they lack the time or the tools to go as far as they would like to, but the turnover rate of good web analysts is quite high right now, so I expect folks will get the time and tools pretty soon! The evangelizing conversation leads to a “mix” of culture, people, tools, pain points, and so forth.
Personally, I think the way to do it is to take a core concept and explain it in as many different ways with as many different examples as possible. This allows people to pluck out different parts that make sense to them and rebuild something customized to their own situation, the “mix” of all the above they face. Not too many “one size fits all” kinds of situations out there, with the possible exception of classic DM operations. They basically get much of this behavioral modeling stuff already, though they might not understand how to cross this knowledge over to the web yet.
The real challenge to all of this is the lack of an “analytical culture“, which is why I talk about that so much. There are plenty of people who are willing and able to go down the analytical road, but for various reasons, just cannot get past the roadblocks.
Hi Jim,
Thanks for the interesting series of articles. I particularly engaged with the application of RFM models to online activity.
A couple of questions.
Firstly, for those who are using the free analytic tools like GA where PII restrictions means that segments are aggregates of IP addresses/browsers rather than addressable individuals, how are you tying up the web data to the allocation to one of the four segments ?
Secondly, for those that are able to develop models of customer interaction including online activity, are you seeing RFM models augmented by both Channel and Product/Product Area segments to more finely tune these segments? Or is that way beyond most organisation’s abilities currently ?
Regards
Dan Croxen-John
Hi Dan, thanks for the comment.
1. Not sure I fully understand this question. I’m not a GA expert and have not played with the new advanced segmentation, so don’t know the capabilities.
That said, the above example was based on Campaign averages, not individuals, so I’m not sure it matters. If individuals in the aggregate can be tagged with a campaign source, and then the average Recency and Frequency calculated, that’s all you need. Don’t know if GA can currently do this at the Campaign level, but they certainly have the info on Recency and Frequency and could do it in the future. The idea of “Relative Camapign Performance in the Future” is certainly important enough they should consider it, if not available now. Please not the camapigns would have to start at roughly the same time for the Recency to be comparable.
2. Sure, there are people doing this, though it’s not common yet and the level people are taking it to varies widely. Just like offline, you can “reverse engineer” or turn inside out any RFM cell and see what the composition of it is. Drivers you will typically see are:
1. Media / Offer, which usually implies channel though does not have to
2. Category / Product, certain Cats / Products are “stars” with high satisfaction / repeat and others basically create low value customers
3. Channel, though clearly the view from corporate and the channel need to be reconciled to be useful, e.g. if a customer is defecting from one channel to another, is that really a defection? Is it OK for one channel to “steal” another channel’s defecting customers? Does the original channel have a “right” to first try to retain the customer? Messy…
There are other primary drivers of behavior, but they are more applicable to longer cycle (LifeCycle) studies rather than RFM / Campaign oriented work.