Not sure if all the web analytics folks out there will appreciate this post, but I’m pretty sure at least some of you are interested in how all the things we talk about in the Web Analytics / Database Marketing world fit into the larger world of Marketing. So following on a question from Judah on depth of segmentation, and a post you should read from Gary on joining behavioral and demo / psycho segments, I thought I would offer this example.
One of the challenges people seem to have with behavioral segmentation is finding a way to organize it in their mind. It just seems too overwhelming to think of Marketing to individuals at the “right time” based on behavior as opposed to some “calendar” idea where you communicate to everybody at once.
If you want to create a “structure” or “process” to hang behavioral communications on, try this one.
Below is a chart I created in 1993 to explain what Marketing looked like at HSN (you can click for a larger image in a new window):
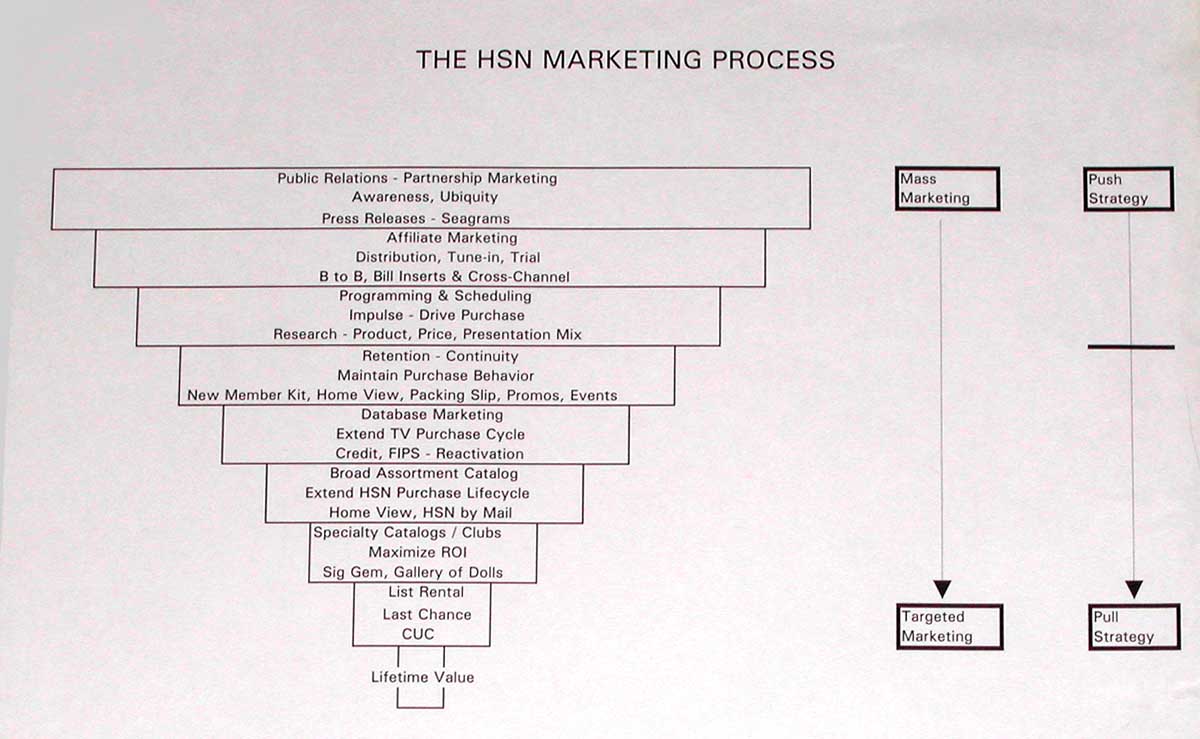
The format for each level in the chart is:
Type of Marketing
Purpose of Marketing
Tools / Tactics
I’d like to point out a couple of things.
1. Note that I used the word “Process” in the title. This is reflective of a real step by step road the customer takes, as opposed to a “Marketing Blast” kind of idea. Each step has a specific Goal and Outcome and is measured that way; some measurements are more precise than others. For example, in this world, “Brand-ing” has a role but it’s a specific role, it’s not “everything”. By the way, “Affiliates” in this case are cable systems carrying the HSN signal.
If you like, this is what the AIDAS Strategic model looks like when you fill it with Tactical Action programs. It’s also representative of the “cascading metrics” methodology covered extensively in Akin’s book.
2. I suppose no web analyst out there missed the fact this chart looks like a funnel. It is. The difference between this funnel and a “Scenario” funnel is you don’t really have knowledge of “who” in the top 3 layers, these targets are “audience” as opposed to individual visitors or customers.
In terms of segmentation, these top 3 layers are the psycho / demo ideas; as soon as you pass Level 3 you are into the first purchase, where the segmentation becomes behavioral. Since at this point we have real data on the customer, the behavioral segmentation is more actionable than demo / psycho in terms of increasing customer value.
The widest “Reach” is at the top layer, but it’s the least targeted. The finest segmentation is at the bottom layer, where the Marketing is absolutely hyper-targeted and very specific to the individual customer.
3. You can see on the far right two continuums (continnua?) – Mass to Targeted Marketing and Push to Pull Marketing. The transition area between the two is the 3rd to 4th layers (dark bar in the Push / Pull continuum), where you get into Retention and Continuity Tactics; now that you have customer data you can engage in these activities.
Generally, these shifts happen pretty much together, so Mass Marketing = Demo / Psycho Segmentation = Push Marketing, and Targeted Marketing = Behavioral Segmentation = Pull Marketing.
4. Another way to view this chart is as the Customer LifeCycle, which starts with general Awareness and ends with Customer Defection and a final tally of LifeTime Value and ROMI. At HSN, the Catalog business generated the most incremental value as a Retention Device, so it kicks in on Levels 6 and 7, first as a general merchandise idea, then as a very targeted category idea.
For those of you wondering where the web is on this chart, we bought the first web property in 1994, after this chart was created. But on the web, the core idea is much the same. Different tactics have different primary purposes and they should be treated and measured that way, not just “Blasted” out in one continuous Marketing puke.
The impact of these tactics should be measured at the customer level (not campaign level) whenever possible to really understand the net value added. That’s how you optimize the system.
Now, I have two questions for you:
1. Did this chart help explain at all what the heck I’m talking about on this blog, or some other Marketing / Analysis issues?
2. Do you have any questions?
I could go on and on about this chart in my language, but I would rather have you (especially the tech-oriented folks) ask questions in your own language, since:
* It seems like we get better knowledge transfer that way!
* I don’t know what you don’t know; stuff that’s obvious to me after 25 years of Marketing is probably completely opaque to you.
So, any questions?
(A post by post index of this Marketing Bands Series is here.)
Thanks Jim!
Yes it does make sense, and I think the key concept has finally clicked for me.
Basically you are progressively refining your… message?/communication as customers become more valuable; and/or over a given customer life cycle relationship with “your” organisation.
For some reason I couldn’t get it into my head that the communication to customers would be banded (segmented?) that way. Seeing the diagram like that – with the explanations of what each means – makes it so much clearer!
Just don’t let Judah know that his earlier comment(s) went right over my head. ;-)
Again thanks!
Cheers!
– Steve
Steve, thanks for participating in my experiment!
I like the language you used – “progressively refining” based on value and the idea of “Bands”. Perhaps communications are Banded, customers are Segmented? A Matrix? In other words, within each “Band”, there are still different Customer Segments, though this is much less clear in the higher Bands.
Maybe rather than a funnel, what we have here is more like a series of screens, with smaller and smaller holes as you approach the bottom? Like the way soil is screened for different sized rocks and sand, by shaking a screen table?
If so, perhaps these screens are called “Relevance” and Marketing is the motor doing the shaking?
Anyone else care to jump in with their own language on this optimization model? To be clear, the Tools / Tactics listed are what was left after optimization for each Band. For example, TV, Radio, Newspaper, TV Guide were all kicked out of the top Band.
I work in marketing at an Auto OEM where we use the funnel to get a grasp of prepurchase behavior. (We survey 2 year out purchase intenders on a continuous basis). We have been doing this for many years now and the discussions are mainly about our communication strategy and little else. It has been helpful but ignores our web, service, call center and data warehouse folks (as well as sales/dealers).
Putting together all this data would be a more accurate picture of our marketing effort. Your chart gives me some clarity as to what the end should look like. It feels right but at the same time daunting.
Off the top of my head, I think where my challenge will be is quantifying the traffic generated from steps 1-3. (I can’t get accurate dealer traffic counts).
It may not matter in the scheme of things but let me defer to your expertise… Can this be done in the auto world? Any thoughts?
Hi Moe, thanks for participating in the experiment!
I think in many cases, on those 1st 3 Bands you simply get what you can get and that has to be good enough because there is no rigorous way to prove customer value generation.
For example, I think people are spending way too much time on trying to “measure the value” of social media. That’s like measuring PR; it simply is what it is. Can be nice to have, can be bad. Try not to generate “bad social” (or PR) if you can.
I’m not saying don’t *track activity* in these 3 bands, I’m saying if you can’t truly measure the end $$ value of it, don’t bother trying, don’t kid yourself. It just is what it is.
You can create all kinds of formulas if you want to, but the reality is that “X number of PR mentions on TV” rarely ever equals the value of a TV spot. And even if it does, you’re talking media value, not customer value. Not the same thing. The real question is this: how does media value created translate into customer value, what kind of profit was generated? More on this below.
Clearly Band #3 is something the auto industry understands – it’s the product, or what we would call at HSN the Merchandising, which for you probably happens in Design / Engineering. It’s the feature sets, the compatibility, the colors, the packaging. I assume you have some primary research that gets done around that. As far as Optimizing, you may need more Marketing or Customer Service input, for example – are the Engineers really building what the customer wants?
This is where your call center could provide input, you could look at return / refurbish rates in the data warehouse, service calls, etc. and trend those over time. Lower return rate, product is better. Less info calls on how to operate it, design / instructions have improved. That kind of thing. This is relatively “hard data” and even though you might not be able to put a $$ value on it, it’s quite tangible from a customer experience and therefore “likely to buy again” perspective. Lacking hard data, “Satisfaction” or NPS.
For Band #2, since this is the Distribution level, it would be highly appropriate to interview store managers / salespeople – is it easy to sell? What are the Objections? Does the packaging work for you or against you? Optimizing means addressing those issues.
You could also make the argument that any well established channels for professional product reviews, meaning expert commentary and endorsement from audio magazines, or car mags, or Consumer Reports, or whatever, are in Band #2. These are part of “Distribution” but certainly leaning towards Band #1. Track and trend all the sources, positive and negative reviews.
Band #1 is the Mass Communication level, the least targeted but potentially has largest reach. Certainly you could try buying cable TV, let’s say the SPIKE channel or ESPN, advertise in auto mags, etc. How will you know it’s effective? Either design that into the campaign or forget about it. You can certainly do “awareness studies” and “marketing mix” and all that, but these are very hard to turn into hard $$ value generated if you’re not P & G.
At HSN, we could do geographically controlled market tests and proved that mass media did not deliver a financial benefit anywhere near it’s cost, so we killed all of it. The media value did not translate into customer value. Doesn’t mean the media had no value, just that we couldn’t convert the media value into customer value, or cross this media value over into Band #4, if you will. This concept of “crossing over value” is really no different than understanding how much you pay for PPC clicks relative to the profit you generate, just using a different media.
The social “buzz” kinds of things are probably very appropriate to track for this product category. How many product mentions on auto blogs, Facebook / Myspace / Flickr if appropriate; how many phrase matches in Google, etc. Compare to any trends you have for similar product launches, lined up by launch date. For example, 2 months after launch of Version1 we had 40,000 Version1-specific Google phrase matches; 2 months after launch of Version2 we had 70,000 Version2-specific phrase matches. Good!
But in my opinion, the value of this buzz media was created back in Band #3, where you were listening to Customers, Marketing and Service and designed a product that is worthy of the buzz it generates. If you fail in Band #3, you fail in Buzz. In other words, the value of the buzz media generated is a result of investments at Band #3, not “new value”. Same thing with Service related Buzz; it’s created through Optimizing procedures, right-sizing policies and training / empowering service people.
Can you measure the hard $$ value of this buzz activity? No. But you can make a judgment as to whether it’s good or bad, and that just is what it is. It’s additional anecdotal stuff that either confirms or brings into question the hard data sets you get into as you move into Band # 4, where you are talking about the value of customers as opposed to the value of media.
Hope the above helped!
Jim, Brilliantly simple and simply brilliant! Most of what passes for behavioral segmentation / targeting on the web today is in your upper layers and decidedly NOT based on purchase data.
To achieve scalable reach on the web, BT networks really developed a somewhat better form of mass advertising in that it is targeted to an audience whose behaviors (or interests, really) are inferred from context. Even remessaging to a site’s previous visitors doesn’t automatically tap you into consumers’ propensity to buy. Maybe they just like your site and never buy. Or they already bought and won’t do so again for a long time.
True behavioral marketing online uses actual shopping and purchase data, a multitude of variables (including likelihood NOT to buy) and analytics. Post-1993, you need to model massive amounts of actual shopping data to best predict purchase intent.