The Measuring Engagement series starts here. For a clickable index of the 5 part Measuring Engagement series, look here.
If your head is kind of splitting over the last post on Measuring Retention / Engagement and you’re looking for a bit lighter explanation of the concept, I offer it to you here, from the first chapter of my book:
——————————-
It was a day just like any other day. The Customer Retention Clinic was open, yours truly at the helm. Both offline and online marketers trudged through, with the same old issues. One is drowning in data. The other has reports that provide no actionable information. Still others have fancy models and profiles, but don’t know how to use them to increase the profitability of the company.
I became aware of a fresh-faced marketer, waiting eagerly in line. Something seemed different about this one. Untouched by CRM. Never been to a Business Intelligence demo. Ignores every e-mail plea to attend “educational” webcasts.
“Your question? I ask.
“Jim, how can I tell if a customer is still a customer?” was the reply.
I stood there, floored by the question. I knew this marketer was special. How elegant, I thought: the summation of 20 years of my work in a single question. Nobody had ever asked it before. They always want to know about the money, you know – how can I make more money, show me the tricks. Addicted to ROI. They start off innocently enough, probably with a spreadsheet. Then maybe a simple model or two. Before you know it they’re into data mining. But they don’t make any money for the company. Devastating.
Then they show up at my Customer Retention Clinic, looking for the magic bullet, the secret to ROI. But not this one. No, this one was special.
“Why do you want to know?” I asked.
“Because I want to calculate our customer retention rate and track it over time” was the answer.
“You can’t put a retention rate in the bank, you know” was my cynical answer. “What you really need is a formal, widely accepted definition of when a customer is no longer a customer in your company. Then you will be able to get at your precious retention rate.”
Silence from the fresh-faced one. Then:
“In customer service, they say only 10% of customers complain and tell us they will stop doing business with the company. They say this means customer satisfaction is 90%. Does that mean customer retention is 90% too?”
Well, it’s all well and good to be fresh-faced, but now we’re getting into naive. Still, I think, maybe there is something here, something worth saving for the future of customer marketing.
“Are you saying the only defected customers are ones you have documented?” I sneer. “Ones who told you they will never do business with you again? Look, to me, a customer is a person or company you sell stuff to, who pays you for a product or service. You have identified 10% who are not going to buy from you anymore; they are definitely defected customers.”
“But the word customer implies some kind of “future activity, doesn’t it? I mean, if you know they will never buy from you again – as in the above complaint example – you don’t call them customers, so the opposite must be true: to be a customer, there must be expectation they will buy again. If you know they will not buy again, they’re former customers, correct?”
“So the definition of a customer would be someone who:
1. Purchased from you in the past, and
2. Is expected to purchase in the future.”
“Just because somebody bought from you in the past and did not tell you they hate your guts now does not mean they are still a customer. A customer is somebody you expect to transact with you in the future; otherwise they are a former customer, by definition.”
Not a bad sermon, I think.
“Wait a minute, says fresh-face, “what about customers who purchased in the past that we have no expectations for? We don’t have any idea whether they are likely to buy or not, there is no “expectation. What about them?”
Oh, so fresh-face is going to play tough with me, I think. Probably has an MBA. Wait a minute; I have? an MBA (though I got it 20 years prior to his, no doubt). Is it getting hot in here?!
“Listen, you know the answer to that question, don’t you? Because you don’t know crap about the people you sell to and their likelihood to buy, you simply call them all “customers. You have no more reason to call them customers than to call them former customers, but of course, you “default” to calling them all customers. They didn’t call up and tell you they are not customers, so they are, right?? Is that what you are saying?” It is hot in here…phew.
I go on? “What if they didn’t tell you they hated your guts, but they told 10 other people they would never buy from you? Are they still a customer? Do you know how many there are? How many have had a bad product or service experience and never said anything? Is it 10%, 20%, 40% of your customers?”
No reply. Floor staring from the face-man. I have caused hurt feelings. But I have got to move on, there are all these people waiting for their magic bullet, people who need a customer marketing fix, they’re Jonesin’ for Some ROI.
“Look, I’m sorry” I say half-heartedly. “Let’s come at this from a different direction that will perhaps be more helpful. Let’s take all the customers who you think are customers, and ask just one question – when was the last time you had contact with these people?”
“For example, the last time you had any contact with a customer was 3 years ago. Are they still a customer? With no activity for 3 years?”
“Maybe” says fresh-face.
“OK, fine. What about if the last contact with the customer was 5 years ago? Is this person or business still a customer?”
“Maybe” is the reply.
“10 years ago?” I ask, sweating.
“Maybe.”
That worked like gangbusters, I think. No wonder nobody knows how to sell more to current customers while reducing costs. All customers are customers for life – unless they tell you they aren’t anymore. Sometimes it seems as if today’s marketing people have no sense of reality. They are thinking every person or business that ever transacted with them is still a customer!
“All right, one more try,” I say impatiently.
“Take two customers , the last contact with one was 10 years ago, the last contact with the other was 2 years ago. Would you be willing to go out on a limb and say the “customer” you last had contact with 2 years ago is more likely to still be a customer than the customer you last had contact with 10 years ago?”
“Yes,” says the face.
“Finally,” I gasp. “And if the customer you last had contact with 2 years ago is more likely to still be a customer than the customer you last had contact with 10 years ago, is the customer you last had contact with 2 years ago more likely to purchase good or services from you today than the customer you last had contact with 10 years ago?”
“Sure.”
“More likely to purchase goods or services now, and in the future, from you?” I wheeze expectantly.
“Yes” is the reply.
“So, let me get this straight – when comparing two customers, the customer you have had contact with more recently is more likely to purchase, relative to the other customer?”
“I would think so” is the answer.
“What?” I gurgle, starting to lose my balance, eyes becoming glassy…
“I mean yes, Jim…”
“Then, if I was to define a customer as someone who:
1. Purchased from you in the past, and
2. Is expected to purchase in the future,
you would say the customer you last had contact with 2 years ago was more likely to still be a customer than the customer you last had contact with 10 years ago? Would you say that?” I ask breathlessly.
“Yes!” the face shouts triumphantly. “I get it!”
“So for any two “customers, the one you had contact with more recently, relative to the other, is more likely to still be a customer and keep purchasing goods or services from you, now and in the future?”
“Yes!!!” fresh-face screams.
“So as a marketing genius, you would then go out and treat these two customers exactly the same, spend the same amount of money marketing to them and servicing them, even though one is more likely to still be a customer and purchase than the other?” I scream back.
The trap was set.
“Yes!!” face blurts out. “That’s what we do! We spend the same amount of money and resources on every customer, regardless of their likelihood to still even be a customer!
“I know, your company and most other companies out there. The question is why do you do this, when it is so darn easy to tell which customers are more likely to purchase goods or services relative to the others?”
And that, Dear Driller, is what this book is about. You are going to learn some very simple techniques for tracking which customers are more likely to purchase goods or services from you, and then you will learn precisely what to do with this information to increase your sales while cutting your marketing costs.
Because I don’t want to see you down at the Clinic, the line is too long already.
First, we’re going to talk a little bit about customer models, what they are and are not. Then we’ll put a little background in place so you understand the basic objectives and strategy behind High ROI customer data-driven marketing. Next, we’ll take a look at the simplest model of all – Latency – because it is the most intuitive model and often the easiest to implement for those just getting started with customer behavior models. Then it’s on to the Recency and RFM models. Often used in tandem with the Latency model, Recency and RFM are smarter than the Latency model but a bit less intuitive.
And finally, we’ll jump into the whole Customer LifeCycle marketing methodology and show you how to use what you will know about simple customer models to really drive the profitability of your customer marketing / retention / CRM programs. By understanding what the customer is likely to do even before they do it, you can use your modeling intelligence to craft the most profitable customer marketing programs you probably have ever been a witness to. The Customer LifeCycle is the key to the fabled “right message, to the right people, at the right time” marketing kingdom.
By the end of this book, you should be able to very clearly answer some basic marketing and service questions about your customer base. Questions you no doubt have asked many times yourself, such as the following:
Who do I provide marketing or service programs to? When? How often?
Should I contact some customers more often than others? (Yes, you definitely should.)
How much and what kind of incentives should I provide to get a customer to do something I want them to? Can I predict which customers will be responsive to the program? (Yes, you can)
How can I tell when I’m losing a customer or when service has failed?
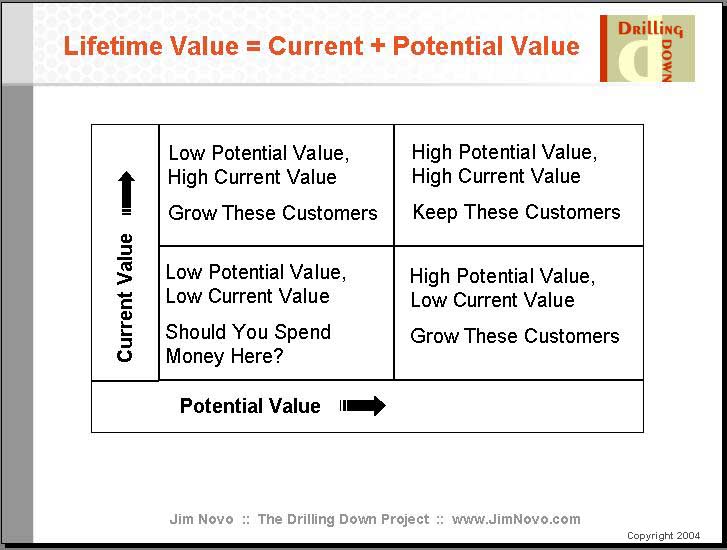
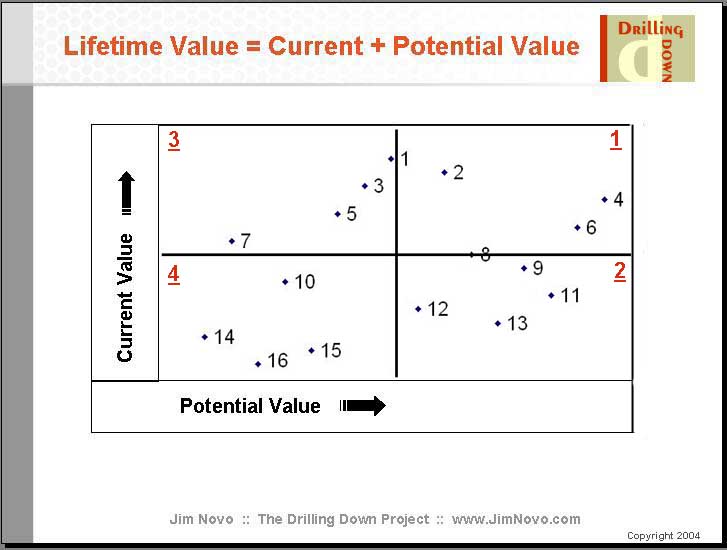
How can I put a value on my different customers and the business as a whole now, and project this value into the future?
Is my business strong and healthy, or becoming weaker?
What can I expect in future sales from my existing customers?
So what do you say, fellow Driller? Ready to cut that line at the Clinic?
The next post in this series on Measuring Engagement is here.