For a clickable index of the 5 part Measuring Engagement series, look here.
Ron ends this post on customer Engagement / Retention with:
“While the ROI may not be immediate, an investment in engagement is better than an investment in retention. The key to future profitability isn’t in simply keeping customers – it’s from deepening their relationships. And engagement is a necessary pre-condition for that to happen.”
I don’t disagree with the thrust of this idea, but I also don’t see any real difference between retention and engagement, so I can’t do one instead of the other. To me, a retained customer is one that is actively engaged, and that is how I measure retention – through engagement. In other words, Retention describes a Customer “status”, and Engagement is how one actively measures and manages that status – this is what I always thought CRM was supposed to be about.
Now, if you have never defined a defection or have a really meaningless, non-actionable definition of retention, then I can understand why you might swap one for the other. For example (and I’m just thinking out loud here), if a bank’s definition of a retained customer includes a customer that has a small amount of money in the bank and just leaves it there, with no transactional activity, for 10 years – they are probably counting dead customers as “retained” and certainly need to take a look at their definition. The dead are not very actionable, don’t you know. I can see why this might cause a problem, and the bank might be looking for a little “engagement” to really define a retained customer. If that’s the case, the bank should change the definition of retention to something that really represents a retained customer (which includes active engagement), rather than “swap” retention for engagement.
But let’s not get caught up in Buzzword Bingo. Ron’s work (and attempted hijack of retention!) bring up the need for a stable framework addressing this whole customer value management area that can be used by the all the different factions – the Brand / ARF hijackers, the web analytics folks, and even bankers! Funny, I have one that has worked very well for many years across many different industries, both online and offline. I’ll go through the short explanation here; if you want the full development of the idea, check out the book sample PDF.
One of the things we learned at Home Shopping Network was that the more interactive and dynamic the customer environment, the more a typical LifeTime Value approach to managing customer value tended to break down. One thing that happens when you go interactive with the customer is you create many more opportunities to screw things up and sometimes in a bigger way than ever before possible. This means the Customer LifeCycle becomes unstable in new ways we had not seen before. The most significant effect was rapid changes in behavior; in terms of value, customers might either go wild on spending or drop off the face of the earth without warning. So we came up with a “proxy” for Lifetime Value that was much more effective to use when customers are more interactive. It looks like this:
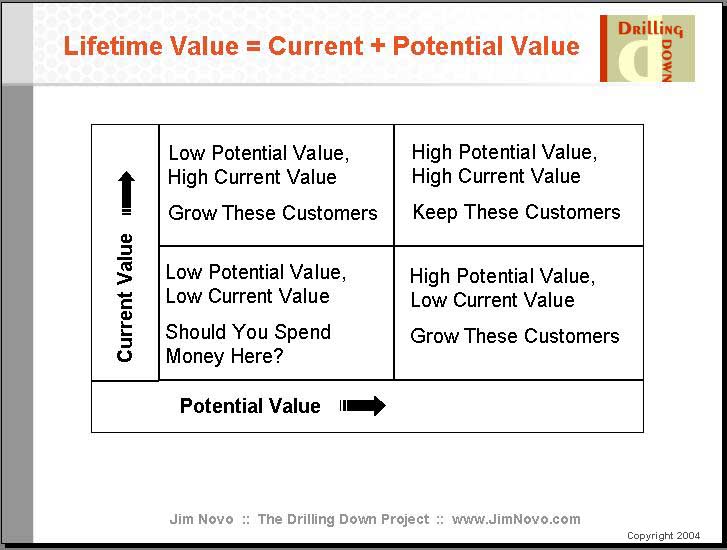
Customers have both a Current Value and a Future or Potential Value; these Values sum to LifeTime Value. Current Value can be anything from the current bank balance / number of relationshipsto how many purchases to some measure of visit activity and length of visit; the point is, the activity happened in the past so there is really nothing you can do about it. This value is “sunk” and both revenues and costs associated with this value cannot be changed.
However, Potential Value can be measured and acted upon. At any one point in the Customer LifeCycle, the Potential Value is in flux – it largely depends on the relationship the company has with the customer, and can increase or decrease. These changes in Potential Value typically take place when the customer has direct interaction with the company, the so-called “touchpoints”. Success or failure from the perspective of the customer and the customer experience at these touchpoints determines whether Potential Value rises or falls.
So what you really want to focus on is measuring the Potential Value of a customer and changes in it, because if you take care of Potential Value, LifeTime Value will take care of itself.
Once you determine the Current Value and Potential Value of each customer or customer segment, you can literally “map” the customer base into quadrants, and take the appropriate marketing action based on which quadrant the customer resides in, as indicated in the chart.? It’s a budget or resource allocation model. Note that this model is similar to Ron’s chart in several ways; his “Breadth of Relationship” is what I would consider Current Value, and “Customer Engagement” is an indicator of Potential Value.
You say, “OK, fine Jim, I get it, I can even measure Current Value – it’s just the number of times a customer did something like visit or post, or the amount of spend. But how do I measure Potential Value?”
Well, Ron’s banking example and Eric’s web analytics example both used Recency – the time since last event – to help define “engagement”. For example, Ron used “in the past six months” to qualify the Current Value components “How often did you move money between different accounts”and “How often did you check your savings rate”. The more Recently the activity occurred, the more “engaged” the customer. As long as you believe that engaged customers have higher Potential Value (and everybody seems to think so!), then Recency is your Potential Value metric. A different but similar metric to measure Potential Value that often makes more sense in B2B and supply chain is Latency, the time between events. We’ll skip Latency here, but if you are interested in that side, check out The B2B Software Example. Same idea as below, different metric.
Now, I imagine some folks are having trouble visualizing what this Recency / Potential Value thing is all about, so let’s go to the pictures. Let’s take a look at the Recency metric to describe the Potential Value of visitors to a web site:
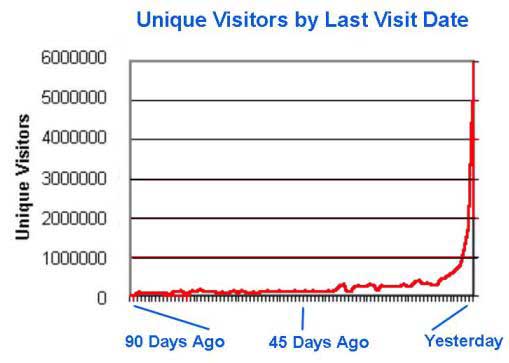
Here we have about 6 million visitors to a web site over a 90 day period. This is a program that requires log-in to view content, so these are all authenticated visitors. Note that the vast majority of visitors have visited in the past few days, and then you have a bunch whose last visit was more than a few days ago, all the way out to last visit 90 days ago. If you believe that visitor engagement has value to the web site, and you believe that Recent activity is indicative of engagement, then all you need is some proof that the more Recently a visitor has visited, the more Potential Value they have relative to another visitor. Right?
Each day of the 90 days represented on this chart contains a number of visitors whose last visit was on that day – last visit 90 days ago, last visit 89 days ago, and so forth. What if we tracked those groups for another 90 days to see if they visited the site again or not, to see if Recency of visit predicted likelihood to visit again? That’s just what we did, and for each day of last visit in the chart above, created a ratio of those who visited again to those who did not. The red line in the chart below = 1, meaning the number of people who visited again in the next 90 days equals the number who did not visit again:
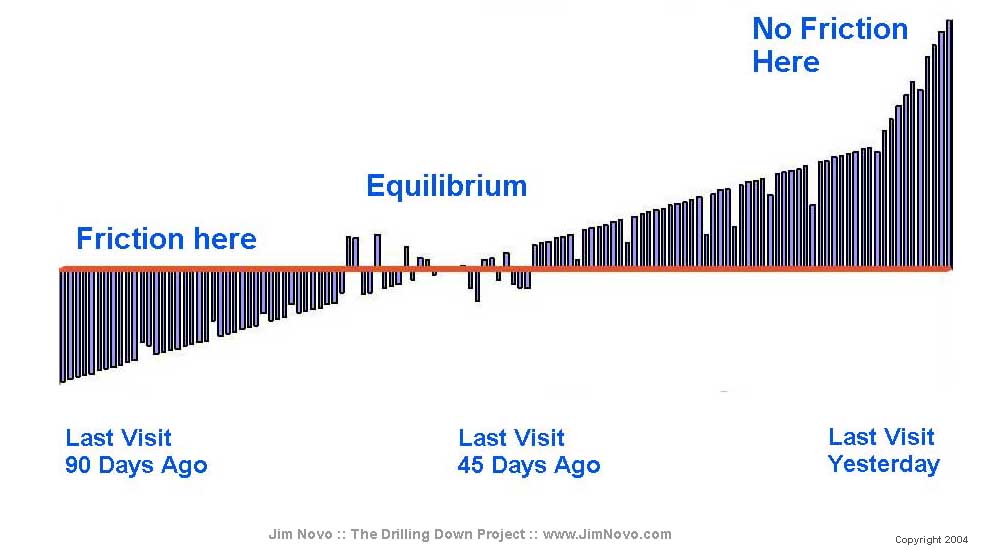
Example: at the point labeled “45 days ago” in the first chart, there were 50,000 visitors whose last visit date was 45 days ago. When we looked at those same visitors 90 days later, 25,000 have visited again and 25,000 had not. 25K / 25K = 1, so visitors whose last visit was 45 days ago are just as likely as not to visit again. Bars below the red line indicate fewer visitors visited again than did not visit again; bars above the line, more visitors visited again than did not visit again.
Scary, huh? Like someone wrote a mathematical equation to describe the function. But it’s not math, it’s simply Frictionless Behavior (for more on Friction, see the book PDF). In this example, someone who visited yesterday is 484 times more likely to visit again than someone who visited 90 days ago. In other words, the more Recently the visitor came to the web site, the higher the Potential Value of the visitor, since they are more likely to come back and generate revenue for the web site in the future, relative to other visitors. Visit Recency is predictive of Potential Value.
Ironically, Recency is probably the single most powerful Branding engagement metric you could possibly think of – just don’t tell the Branding folks it comes from Database Marketing, please. We’d like them to use the metric, because it would really help build a bridge across all this “marketing confusion” that is out there on the web. It certainly would help if we could standardize on some kind of model that provides common ways to measure the success of both Brand and Direct.
And just to be clear, you can rank the Recency of any activity your customers engage in, online or offline. It might be certain types of bank transactions, for example. Or purchases. Or downloads. Whatever is an indicator of value to your company can me measured as both Current Value and Potential Value to create the model and customer mapping.
Customers with high Current Value and Low Potential Value are of the most concern; they are Best Customers in the process of defecting from your business, they are sliding down the slope in the graph above from right to left, they are becoming less and less likely to engage, they are losing Potential Value. In the model, it means they are falling from the “Keep these Customers” box to the “Should You Spend Money Here?” box.
Another way to say this is Frequency or Sales (Current Value) by itself is not equal to engagement. A customer that has purchased 10 times and the last purchase was 5 years ago has much less Potential Value / engagement going on than a customer who purchased 10 times and the last purchase was a month ago. Recency matters, it predicts Potential Value. Those of you who are counting Frequency to determine how well you are doing (we have 600 customers who have purchased over 20 times!), particularly if you are using this metric to project future financial success, really need to take a look at what percentage of those Best Customers have purchased Recently. Wall Street knows about Recency and they can punish you severely for not understanding it.
You say, “OK Jim, makes sense. But as a marketer, what do I do with this, how do I use it to increase profits or better manage the business?”
Well, the first thing that comes to mind is this: you don’t want customers sliding past “Equilibrium” or 45 days in the chart above, where they start to become less and less likely to engage. You want to try and engage them before they get there and drive them up into a more Recent interaction. How specifically you do this is a creative exercise and will depend on the business; “thanking customers” in some way is usually appropriate, especially if it drives Surprise and Delight. In terms of budget though, this model narrows your targeting and so allows you to spend more on specific people.
For example, if you are limited (to stick with banking) statement inserts, instead of sending the same lame “retention” insert to every customer, why not come up with something that is high impact (engagement insert?) and send it only to high value customers getting ready to pass through the Equilibrium point on the Recency chart? Not only will you be delivering the “right message, at the right time, to the right person” but it will probably cost less overall and be more effective than the generic insert.
So, you need to:
1.Identify the most relevant value generating interactions with customers; this allows you to map Current Value and Potential Value. Current Value is simply the Monetary Value or Frequency of these transactions to Date or in the past several years; Potential Value is the Recency of the last interaction. If you have multiple contributing interactions, say “move money between different accounts” and “check your savings rate”, you can map each separately and see which is most predictive of customer engagement / retention.
2.Segment your messaging by Recency and measure performance; you are looking for the “sweet spot”, the highest response or profit related to re-engagement. For example, you can segment customers by number of months since last action, and then determine which of these buckets generates the highest ROI or re-engagement relative to the cost of your campaign. Here is what this looks like with e-mail:
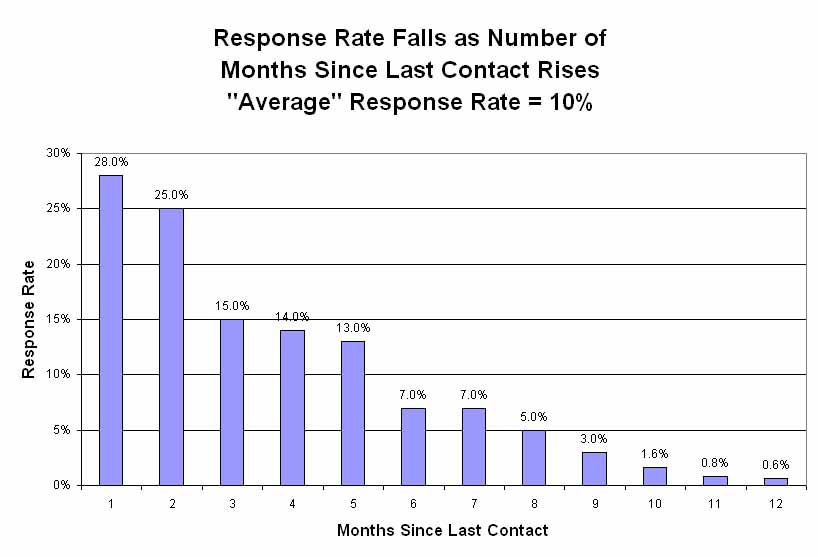
This campaign gets a 10% response rate. But if you look inside it by monthly Recency buckets, the more Recent the last open or click was, the more likely you are to get another open or click. So while your overall “response” was 10%, it you look at it by Recency of Previous Interaction, it was anywhere from 28% to .6%. You get the same “waterfall” effect by Recency seen in the Visitor stats above, and where the big drops in interaction are – in this case at 3 months and 6 months – are most likely the highest ROI or best re-engagement opportunities you have. At some point in this waterfall, you start to lose money, so you should kill those segments; this is “economic defection” of the customer – the point at which you can no longer increase the value of the customer.
If you would like more info on this tactical track and find out how to turn Recency and Latency data into increased profits, check out the Marketing Productivity Series. If you want more details on the Current Value / Potential Value model, see the book sample PDF.
Your thoughts? Got any questions on the model or the approach?
The next post in this series on Measuring Engagement is here.