(A post by post index of this Marketing Bands Series is here.)
Just wanted to add a quick piece about the results of Optimizing the Bands (see Band Model) – this is the Marketing Productivity Blog after all! Thanks Moe for the reminder.
As we Optimized, there were changes in budget allocation by Band, and as a result there was an increase in Net Customer Value – the goal of the Optimization program in the first place. For those of you not following the whole story, the budget remained constant, we simply allocated it to the highest and best use through testing.
Marketing Budgets, Before and After the Band Optimization
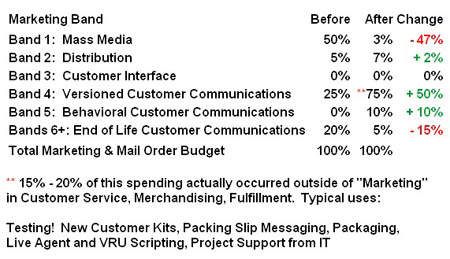
The Zero Budget for Band 3? Marketing spent a lot of time in Band 3 working on the Interface, but the budget for those projects came from Network Operations and IT.
The bottom line KPI for Marketing at HSN at that time outside of individual Campaigns (which had to pay back in 90 days versus Control) was Net Customer Value; a concept similar to LifeTime Value only with a firm endpoint – in this case 2 years after first purchase.
During the 6 year or so period of the core Optimization and including 1 year after, the average 2 year NCV rose from $92 to $126. Just to be clear, we’re not talking Sales here, more like (Sales – Returns) – Cost of Product – Variable Overhead like returns processing, Customer Service Calls, etc. In other words, a fully loaded model from the Finance folks.
(Gulp)
Of course, this average was mightily skewed by best customers, whose NCV rose quite a bit more. This was a detail we could never convince Finance mattered, because it didn’t tie to the financial statements like an “all customers” number.
Hey, you get what you can get…
We spent the same amount of money each year, but spent it a whole lot smarter by Optimizing the Interface for Customer Acquisition and focusing Marketing spend on Customer Retention. Said another way, we let the Interface take care of the pre-Engagement phase (Attention, Intent, Desire) and focused Marketing on the Engagement and dis-Engagement areas (Action, Satisfaction).
“Pull” is a wonderful thing. Interactivity is different, and if you treat it that way, as opposed to simply using the same Push model Marketers use offline – as many onliners do – you can get outstanding results.
If you’re thinking, well, how much of this increase in NCV was due to Bands 4 – 5 and how much was due to things like Optimizing the Interface? I don’t have an answer for you, there was no way to control for Optimizing the Interface, unlike the capability we have now with web sites. A Broadcast is a Broadcast.
But I’m not sure that’s the point with a cross-silo Optimization. The bottom line is the value of a customer increased substantially, and there was enough hard evidence along the way with individual tests that the total increase in NCV was attributed to the Optimization team by Finance. After all, we were using a model for payback that Finance developed, don’t you know.
Keep this idea in mind. It can be a risky way to go, but if Finance provides your payback model, and you have the guts to beat it, then you can get an open checkbook.
In other words, the CFO was completely on board, and post Optimization asked if we needed more money to “keep doing what you are doing”. In the end, that’s all the confirmation the team needed.
Questions on this?
(A post by post index of this Marketing Bands Series is here.)