This is a multi-part series, see: Part 1 – Part 2 – Part 3 – Part 4 – Part 5
Recall our previous sample data sets for tracking customer / prospect / client behavior:
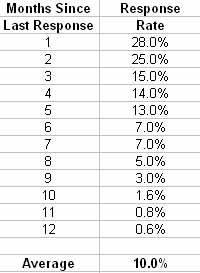
Recency (B2C orientation) from Part 3:
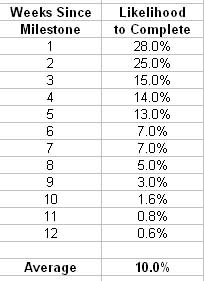
Latency (B2B orientation) from Part 4:
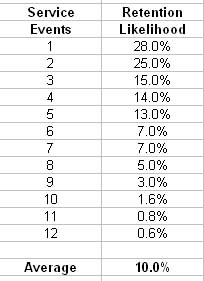
Latency with Frequency (Service orientation) also from Part 4:
In effect, what we have done here is create a standardized methodology for tracking customer / prospect / client behavior using the behavior-based Recency and Latency metrics. What this gives you is repeatability and consistency in your customer marketing programs over time.
The most common frustration people seem to encounter with customer marketing is the lack of ability to increase ROI on a consistent basis; results are all over the map. The reason this happens is usually one of two things:
1. They are trying to construct programs that will influence behavior but are using non-behavioral variables such as demographics or firmographics to target the programs. If you want to modify behavior, use behavioral variables like Recency and Latency.
2. The variables used to construct the program are not able to be “standardized” in a way that is applicable to all potential targets. Again, Recency and Latency are by definition “standardized” and can be applied over and over in the same way for each test.
In other words, a customer who has not purchased in 3 months is simply that; it’s a firm line in the sand, an easily identified, clear, unambiguous variable that will consistently produce the same results when applied to the same population. If you construct a successful promotion for customers who have not purchased in 3 months, it will deliver consistent ROI whenever it is applied. If you are successful at getting people to complete a milestone when they are 3 weeks late but not at 4 weeks late, this will happen each time you drop the same effort to the same population. If customers can be saved after four service incidents but not after 5, this will happen consistently when the same service recovery offer is made to the same population.
So the challenge is this: how do we optimize this system and figure out what the most profitable approach is? How do we increase the productivity of the overall effort?
There are really only two parameters here:
Timing – defined and structured for you by your Recency and Latency behavioral profiles.
Offer – What is it you are going to offer or do to get the B2C customer / B2B prospect / Service client to change their behavior? What is the message and how is it delivered?
Essentially, you have a “grid” (think of a spreadsheet) where Timing segment is the x-axis and offer is the y-axis. For each column of Timing segment, there is one best, most profitable Offer row out of all possible offers that results in highest profitability. This is why it is incredibly sub-optimal to send the same discount coupon to everybody on a B2C e-mail or snail mail) list at the same time.
Sound complicated? Maybe, but the good news is that because we have built in repeatability and consistency by using behavioral metrics. Once optimized, the optimized Timing and Offer combo remains remarkably stable over time given the same target population. And it’s really not as difficult as it sounds. Let’s look at a simple example.
First, classify customers / prospects / clients behaviorally using Recency or Latency as in the sample data sets above.
Take a 10% random sample of targets from each segment (every 10th person in the segment, in the examples above, there are 12 segments), and send all of them a promotion with the same offer / creative, say 20% off any purchase in the next 30 days, or a bonus for completing the milestone. Make sure you are tracking response by behavioral segment and not some other value.
Look at the response rate by behavioral segment. You will find response falls off significantly as you look at segments further back in time, or further out from missing the milestone, or higher numbers of service incidents. You now have a baseline on response by behavioral segment, and it should look pretty similar to the examples above. The numbers will be different, of course, but the performance of the segments relative to each other should follow a similar pattern.
In addition, you can now predict the response rate of a customer to this promotion based on what behavioral segment they are in. The response rates to the same promotion by segment relative to another segment will always be similar, barring any major changes in the composition of the customer base or significant external events. If you can predict response, you can control results.
Now, the response rate in any one of the 12 segments above is influenced by the value of your offer, and both response rate and the cost of the offer have significant impact on the profitability of your campaign to any segment.
As offer value increases, so does response rate, and so do costs. Ideally, you want to find the ideal mix of response rate and offer value creating the highest profitability for each segment you promote to.
So, pick any one of the segments from your test above and now test offer value for the segment. Let’s say you used a 20% discount in the first test. Pick a segment (say last purchase 3 months ago), and create a 20% random sample of the segment (every 5th customer) divided into 4 equal test groups. Send each test group a different discount – say 5%, 10%, 15% and 20%. Look at your response rates and calculate the profitability for the 3 month Recency segment at each discount level. You will find your result looks similar to the following table:
Discount Test :
3 Month Recency Segment
| Customer Sample | 1000 | 1000 | 1000 | 1000 |
| Discount Offer | 5% | 10% | 15% | 20% |
| Response Rate | 2% | 4% | 6% | 8% |
| Responders | 20 | 40 | 60 | 80 |
| Average Price | $80 | $80 | $80 | $80 |
| Totals Sales | $1,600 | $3,200 | $4,800 | $6,400 |
| Gross Margin | 30% | 30% | 30% | 30% |
| Gross Profit | $480 | $960 | $1,440 | $1,920 |
| Discount Cost | $80 | $320 | $720 | $1,280 |
| Net Profit Before Media Expense | $400 | $640 | $720 | $640 |
As you can see, the most profitable offer to the 3 Month Recency segment is 15% off. If you offer 20%, you get a higher response rate but lower profits; any offer under 15% significantly diminishes response rate. Repeat this test for each segment, and you will find the most profitable Timing / Offer combination for each behavioral segment – your Marketing Productivity “grid”. Impressive, huh? Show it to the CFO next time you hear grumbling about marketing budgets or accountability.
Yo, CFO, I got your accountability “right ‘ere” (said with your best NYC accent).
The combined effect from optimizing each behavioral segment will be a significant increase in profitability as you reduce costs while increasing response. As customers / prospects / clients move through this system, your optimized campaigns will automatically compensate to maximize the value of the customer for where they are in the LifeCycle.
For example, let’s say in a service business you have optimized for the 3 incident, 4 incident, and 5 incident segments, optimizing in this case meaning achieved the highest level of post-incident satisfaction by responding in a certain way. When a 3 incident customer is exposed to another incident, your response to the 4th incident for this customer is already optimized to create maximum satisfaction, resulting in an overall gain relative to responding in the same way to each incident. The same thing happens if a 5th incident occurs. These gains compound over time, resulting in a dramatic increase in satisfaction, because the response is customized to the behavioral profile of the client, not on a “one-off” reaction to a service problem. And if you can measure it, you should see a significant increase in customer retention.
In B2C, if a 3 month Recent customer does not respond to the optimized promotion for the segment, the next month they are in the 4 month Recent segment, and automatically receive a campaign optimized for their behavior, their place in the LifeCycle. Discount costs go down as response rates rise. Margins improve dramatically.
In B2B, if a prospect misses a milestone and does not respond to a 3 week stimulation to complete the milestone, they are automatically exposed to an escalating series of optimized efforts designed to get that milestone completed and keep the prospect on track.
And of course, since the determination of the Timing parameter is a simple calculation based on past behavior, once you have optimized the Offer for each segment, execution of the entire Marketing Productivity grid can be automated to run on a monthly basis. Each target is “re-bucketed” monthly based on current behavior and the optimal offer is delivered to the target.
That’s what I’d call the right message, to the right target, at the right time. “Right Time” has always been the most difficult part of this equation. Using time-based behavioral metrics to trigger optimized campaign content solves that problem in a consistent, repeatable way.
Get the book at Booklocker.com
Find Out Specifically What is in the Book
Learn Customer Marketing Concepts and Metrics (site article list)
Download the first 9 chapters of the Drilling Down book: PDF