This is a multi-part series, see: Part 1 – Part 2 – Part 3 – Part 4 – Part 5
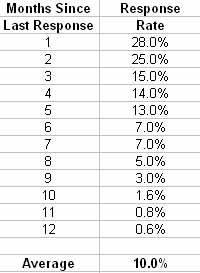
In Part 3, we looked at a typical marketing productivity problem. People generally look at the overall response rate to a campaign instead of breaking response into meaningful behavioral segments. For example, often a 10% response rate is distributed like this (a customer can be in only one segment):
If there is a process with milestones to your business, as is true to in many B2B situations, the stack above is similar, but instead of “Months Since Last Response” the title is “Weeks Since Milestone Passed”. You can find the Average number of weeks between Milestones for your processes, and then set an expectation for customer completion of each Milestone based on the average.
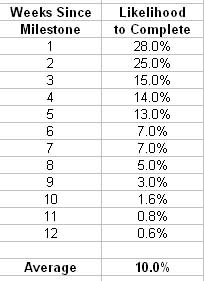
As customers pass a Milestone without completing the desired action, the customer becomes less and less likely to complete the process, whatever that process is. This means that somewhere in this stack – and for each Milestone – there is a most profitable point to trigger an event-based marketing action and get the customer to complete the Milestone.
As with consumer marketing, in B2B often the “source” of the new customer – ad campaign, salesperson, trade show- is predictive of a particular milestone completion pattern. New customers are what they eat, and often you will find specific parts of the acquisition process itself are creating defective customers who fail to complete milestones. If the problem parts of the process can’t be fixed directly, a “marketing intervention” is sometimes required to address the fallout from these failures and extend the life of the customer.
For example, specific types of advertising or salespeople trained by a certain trainer may generate new customers that are less likely to complete milestones or have an unusual milestone path. The marketing productivity approach realizes that ultimately, this is a tremendously wasteful situation and the ads should be rewritten or the salespeople re-trained to create new customers who are more likely to complete the milestone sequence or complete it more rapidly. For this reason, the source of new customers is tremendously important to track, not only in terms of “conversion”, but also over longer periods in terms of milestone completion.
And, remember that in terms of marketing productivity, often the higher the response rate, the lower the quality of the customer or lead acquired. If you create a new campaign that has a higher than expected response rate, bells should ring and those leads or customers should be tracked for milestone completion versus the average new lead or customer.
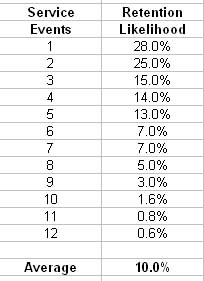
In service businesses, service events are often handled “in the moment” without considering the service history of the customer over time. As customers accumulate events without some kind of service or marketing intervention, they become less and less likely to remain a customer with the company.
Events may also be “thresholded”, as in “3 trouble calls in a month” or “2 billing errors in a year” or other kinds of trigger points.
From a marketing productivity perspective, this is tremendously important information. At some point in this sequence there lies the most profitable point to take some kind of marketing action to save the customer. Clearly, the “natural” progression of the customer’s behavior above means the chance of success trails off rapidly in the out months – if you wait too long to pull the trigger, your response is going to be weak.
Typically, the most profitable time to take action is where you seen significant changes in a natural progression like the one above. In this case, the first occurrence of such a change is at the third event, where retention likelihood drops from 25% to 15%. This implies some kind of marketing intervention after the 2nd event would probably be most likely to have a profitable effect. But don’t guess – test.
As in the B2B example above, new customer source pays a strong role in predicting the likelihood a customer will end up going down a poor service path. This happens because the service expectations of the customer do not match the actual service experience, and those expectations are typically set in the new customer sales or marketing process. Tracking service failure by customer source helps the marketer hunt down these failures and correct them, either directly by changing something on the marketing side or indirectly through a marketing intervention.
The key in both the B2B and service case above is to act earlier than you have been (if you have been acting at all), and when you do act, act with more force. Broadcasting general marketing or service messages to the entire population is a tremendous waste of time and money, from a marketing productivity perspective. And “Win Back” is almost always too late in the cycle and much more expensive than marketing intervention.
You want to find the place in that stack that generates the highest level of profitability for marketing interventions in the sales or service process and hit them hard, with more force. If you are currently spending $1 per customer annually a year on facilitating the sales process or broadcasting service messages, use the “stack” above to find the 20% of customers with highest likelihood of profitable intervention and test spending $5 on each customer to maximize impact. This approach increases the productivity of your marketing spend without increasing your budget; you can always get more budget later on with proof of success.
Next, we’ll wrap the marketing productivity series up with Part 5: Examples of how to take action with this kind of data.
or
Get the book at Booklocker.com
Find Out Specifically What is in the Book
Learn Customer Marketing Concepts and Metrics (site article list)
Download the first 9 chapters of the Drilling Down book: PDF