Category Archives: Web Analytics

Why Use Control Groups?

(This post is more or lessa narrative from my presentation at the 2007 Washington D.C. eMetrics / Marketing Optimization Summit)

“You know that campaign with the best response rate ever, the one with $5 million in sales? We lost over $1 million dollars on it, according to Finance. Something about the difference between Measuring Campaigns and Measuring Customers.”

– Me, giving my boss at HSN a piece of good news, 1991

That, my friends, was the first time I found out just how important control groups are to measuring the success of customer campaigns in an interactive, always on environment.

The Finance department – through the Business Intelligence unit – was measuring the net profitability of the campaign at the customer level. We (Marketing) were measuring the net profitability at the campaign level – based on response to the campaign. The difference was close to $3 million dollars – from a $1.9 million profit using Marketing’s campaign measurement to a nearly $1 million loss using Finance / BI’s customer measurement.

The crux of this difference is always on, self-service demand, or what Kevin calls Organic Demand. The only way to measure these customer demand effects accurately – and so the true profitability of campaigns- is with control groups. Online, this issue is primarily relevant to e-mail marketers (customer marketing) but comes into play in lots of different ways – especially so if you have PPC or display advertising taking credit for generating sales from existing customers.

Seems like there is a lot of confusion around what control groups are and why you should care about them, and I’m hoping this post helps to clear some of that up! But before I lose you in the details, here is why you should care about this topic:

1. Tactically: First and foremost,if you’re not using control groups, you are most likely chronically underestimating the sales / visits / whatever KPI you generate. “Response” is almost always lower than actual demand, because your campaigns generate sales / vists / whatever KPI you cannot track through campaign response mechanisms. Is full credit for what you contribute to the bottom line important to you? If so, stick around and read the rest of the post.

2.Strategically: In a multi-platform, multi-channel, multi-source world, control groups are the gold standard in customer campaign measurement. You will eventually be required to have a common success measurement that can be used for any situation, as opposed to success measurements “customized” for the quirks of every marketing situation that develops.

If you are not using controls, then your campaign results are always suspect. The fact nobody has asked you yet to prove the sales you claim to generate are actually generated by your campaigns is not an excuse; that day will come. Will you be ready?  When “prove it” is on the table, the folks using control groups win over those who are not using them every time.

3.Culturally: The concept of “variance reporting” fundamental to the control group idea is very well understood by senior management. In fact, despite sounding complex, the control group idea is absolutely the easiest to explain to management and generates a tremendous level of confidence in what you are doing.

This is why confidence in controlled results is so high: there are no “caveats” and no need for specialized understanding from management of different channels or technologies. No explanations required for technological causes of error – why does this system say sales were this and this other system say sales were that? No doubts about the source of the ROI, no questions about external effects. Clean and simple, elegant in execution.

Interested? OK, here we go. Here is the idea in a nutshell.

Let’s talk a little about the idea of “incremental”, as in incremental sales or visits. Incremental means “extra beyond normal” or what is often called “lift” in the database marketing / BI world. The central issue is this: if I spend money on a campaign, I want the campaign to generate incremental sales beyond what I would get if I did not do the campaign. That’s logical, right? Why else spend the money, if the campaign is not going to lift my sales over and above what they would have been without the campaign?

In offline retail, Wall Street is always after one KPI – called the “comps”, short for “same store sales comparisons”. What they want to know is for stores open at least a year, what were the sales this quarter versus same quarter last year? That growth, or lift, is what determines how well the company is doing. The reason is simple: if they just look at gross demand, it can be inflated by opening new stores. These new store openings mask the true productivity of the operation, and Wall Street knows productivity is what drives profit growth in retail. So they want to know the incremental sales versus last year of a finite set of stores open at least a year – not the sales of all stores. In using this approach, they are controlling for the new store openings – removing the influence of them.

And that’s exactly what control groups are for – to remove the influence of any number of factors, and arrive at the true driver of the incremental change.

When testing the effectiveness of drugs, one of the control groups is often the placebo – the people who take a sugar pill instead of the real drug. This is done because of the placebo effect – the tendency of a person to feel better when they are taking a drug. Why is this done? Because the testers want to measure the real contribution of the drug – the incremental effects over and above the placebo effect.

OK? So here is how it works in customer marketing:

1. Choose a population to target with a campaign

2. Take out a random sample of that population to use as control – the “control group”. The remaining members of the population after the sample is taken out are called the “test group”.

3. Send the campaign to the test group, and do nothing to the control group. Measure the performance of the test versus control over time, and calculate the incremental impact on the test group of receiving the campaign.

A typical email campaign to best customers might look something like this. Let’s say the campaign has an end date of 1 week after the drop; the customer has to react within a week to take advantage of the offer:
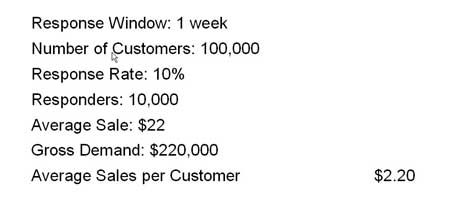
Control Groups Base Case

Respectable results for a best customer target – you do segment best customers out for different treatment, don’t you?

Here is what the same campaign probably looks like using a control group, after one week of response:
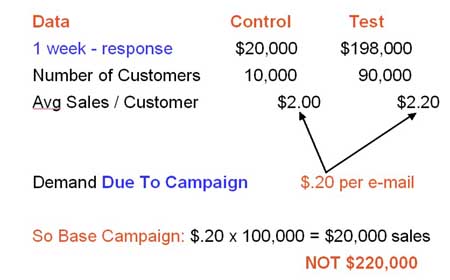
Control Group Static Case

Note that 10% of targets were taken out as control; the remaining 90,000 received the campaign.

If this campaign had dropped to the entire population of 100,000, the campaign that generated $220,000 in sales really generated only $20,000 in sales, because the incremental sales impact of the campaign was only $20,000 ($.20 per e-mail) versus the control group who received no campaign. The other $200,000 would have been generated by this customer segment without the campaign. Follow?

Now at this point, you’re probably saying, “Hey Jim, I get it and all that but there’s no fricking way I’m going to implement this at my current job, I mean, I can’t take a hit like that in performance!”

To which I would say:

1. Don’t use controls until you change jobs – you’ll look like a major scientific testing hero at your next job!

2. You don’t have all the data to make this call yet…we need to talk about what I call “halo effects”.

Halo effects are generally the unintended actions taken by the targets of the campaign. At a basic level, it’s sales generated because of the campaign that you can’t track back to the campaignusing a “campaign response” methodology.

Here’s what this campaign looks like after 6 weeks, when probably almost all the the halo effects would be included. The numbers for each week are cumulative, they include the sales from the prior weeks:
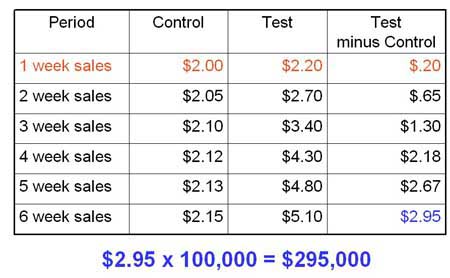
Control Groups Dynamic Case

Now that’s more like it! If this campaign dropped to the entire population (including the control), it would have generated $295,000.

In this case, there were $75,000 in sales over and above what a “response” measurement of $220,000 shows. These sales are coming primarily from people who did not respond to the campaign in a way you could track, but did respond to the campaign.

We’ll dive deeper into explaining how and why this happens, plus address some of the execution and cultural aspects of using control groups in the next post.

Until then, Questions, Comments, Clarifications?
Messaging for Engagement

Or Behavioral Messaging, as we used to call it. 

Much has been written about Measuring Engagement, but once you measure it, then what do you do with this information?  Most folks know the idea driving the Engagement Movement is to make your messaging more Relevant, but how do you implement?  Perhaps you can find the triggers with a behavioral measurement, but then what do you say?

This is the part Marketing folks typically get wrong on the execution side.  They might have a nice behavioral segmentation, but then crush the value of that hard analytical work by sending a demographically-oriented message, often because that is really all they know how to do.  So as an analyst, how to you raise this issue or effect change?

Marketing messaging can be a complex topic, but there are some baseline ideas you can use.  Start here, then do what you do best – analyze the results, test, repeat.

You want to think of customers as being in different “states” or “stages” along an engagement continuum.  For example:

  • Engaged – highly positive on company, very willing to interact – Highest Potential Value
  • Apathetic – don’t really care one way or the other, will interact when prompted – Medium Potential Value
  • Detached – not really interested, don’t think they need product or service anymore – Lowest Potential Value

Please note that none of these states have anything to do with demographics – they are about emotions.  The messaging should relate to visitor / customer experience as expressed through behavior, not age and income.

These states are in flux and you can affect state by using the appropriate message based on the behavioral analysis.  Customers generally all start out being Engaged (which is why a New Customer Kit works so well), then drop down through the stages.  The rate of this drop generally depends on the product / service experience – the Customer LifeCycle.

Generically, this approach sets up what is known as “right message, to the right person, at the right time” or trigger-based messaging.  Just think about your own experience interacting with different companies; for each company, you could probably select the state you are in right now!

OK, so for each state there is an appropriate message approach:

Engaged – Kiss Messaging: We think you are the best.  Really.  We’d like to do something special for you – give you higher levels of service, create a special club for you, thank you profusely with free gifts.  Marketing Note: be creative, and avoid discounting to this group.  Save the discounts for the next two stages.

Apathetic – Date Messaging: We’re not real clear where we stand with you, so we’re going to be exploratory, test different ideas and see where the relationship stands.  Perhaps we can get you to be Engaged again?  In terms of ROI, this group has the highest incremental potential.  Example: this is where loyalty programs derive the most payback.

Detached – Bribe Messaging: You’re not really into this relationship, and we know that.  So we are simply going to make very strong offers to you and try to get you to respond.  A few of you might even become Engaged again.

Can you see how sending a generic message to all of these groups is sub-optimal?  Can you see how sending an Engaged message to the Detached group would probably generate a belly laugh as opposed to a response?  You’ve received this mis-messaged before stuff, right?  You basically hate the company for screwing you and then they send you a lovey-dovey Kiss message.  Makes you want to scream, you think, “Man, they are clueless!” and now you dislike the company even more.

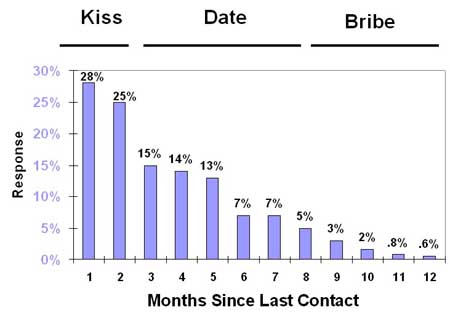
Combine this messaging approach with a classic behavioral analysis, and you now have a strategy and tactic map.  For example, you know the longer it has been since someone purchased, clicked, opened, visited etc, the less likely they are to engage in that activity again.  Here’s the behavioral analysis with the messaging overlay:

Click image to enlarge…

Kiss Date Bribe

Please note “Months Since Last Contact” means the customer taking action and contacting you in some way (purchase, click) not the fact that you have tried to contact them! 

So does this make sense?  Those most likely to respond are messaged as Engaged – as is proper in terms of the relationship (left side of chart).  As they become less likely to respond, you should change the tone of your communication to fit the relationship up to a point, where quite frankly you should take a clue from the eMetrics Summit and not message them any more at all (right side of chart).

Example Campaign for the Engaged: At HSN, I came up with the idea of creating some kind of “Holiday Ornament” we could send to Engaged customers.  If the idea worked (meaning it generated incremental profit), we could do it as an annual thing; we could put the year on the ornament and create a “collectible” feel, which is the right idea for this audience.  No discount – just a “Thank You” message “for one of our best customers” and “Here’s a gift for you”.

These snowflake ornaments were about $1.20 in the mail (laser cut card stock) and generated about $5 in 90-day incremental profit per household with the Engaged, test versus control.  Why?  Good ‘ol Surprise and Delight, I would bet.

We had some test cells running to see how far we could take this, and as expected, the profitability dropped off dramatically based on how Engaged the customer was.  If the customer was even minimally dis-engaged – no purchase for over 120 days – there was very little effect. 

Interactivity cuts both ways; it’s great when customers are Engaged, but once the relationship starts to degrade, folks can move on very quickly emotionally.  That’s why it is so important to track this stuff – so you can predict when your audience is dis-engaging and do something about it.

Data, Analysis, Insight

Poor BI; still struggling with broader adoption – as outlined by Ron in the post Four BS BI Trends (And One Good One).  So Gartner identifies BI as the “number one technology issue for 2007” then immediately pulls out this old chestnut as BI Trend #1: There’s so much data, but too little insight.

Sigh. Â

Then I get this comment by Ron Patiro asking: Besides simply not being actionable, what are some of the common pitfalls and tangles of metrics that analysts get themselves into in the pursuit of engagement?

These two ideas are closely related.  The “common pitfalls and tangles of metrics” are often the reason people get a “so much data, but too little insight” experience.  Let’s explore these issues a bit.

The primary reason you get a “so much data, but too little insight” situation – if you have an analyst to work with the data – is indeed the actionable analysis problem, as Ron P.  points out.  But, there are at least 3 versions of the actionable analysis problem, one obvious and two not so obvious:

  • Producing analysis that isn’t actionable at all
  • Producing analysis that is valid but too complex to be actionable, and
  • Failing to act correctly on a valid and easy to understand analysisÂ

And often, I find the Root Cause of these three problems (to answer Ron P’s question) to be faulty segmentation logic.  This condition in turn often is born of a situation many web analysts are familiar with by now: No Clear Objective.  But let’s leave the segmentation discussion for later and examine each of three cases above.

One cause of the “too much data, no insight” experience is producing analysis that isn’t actionable at all; it’s literally worthless and cannot be acted upon.  This is the most common vision of the “actionable analysis problem“ but probably not the one causing the majority of the negative outcomes.  Analysis can be “actionable” from the analyst’s perspective, but not the business perspective.  And if no actual business action takes place, no real insight is gained.

In my experience, people spend an incredible amount of time analyzing things that will never create impact.  Even if the analysis produces something that looks actionable, often the execution is impractical or financially irrelevant and so is not acted upon.  Just because you can “find a pattern” does not mean the business can do anything productive with that pattern.  Randomly “mining for gold” is one of the biggest time wasters around, and why people are often dissatisfied with the result they get from black box data mining projects.  You have to start with an actual business problem of some kind, preferably one that if solved, will increase sales or reduce costs, or no action will be taken.  Otherwise, you have simply created more data to add to the “too much data” side of the problem.

The bottom line for this slice of the problem: The intent and result of the analysis might be actionable, but unless there is a clear business case for acting, you have just contributed to the actionable analysis problem.  In other words, there is a difference between an analysis being “actionable” and having people actually act on it.

The 2nd slice of the “too much data, no insight” problem occurs when the analysis is too complex.   In Marketing at least, complexity introduces error, and probably more importantly, hinders the explanation of the analysis to people who might take action and gain insight.  If a Marketing person can’t understand the analysis, how are they going to formulate a campaign or program to address the problem, never mind get budget to act on the analysis?  Please note I’m talking about the analysis, not solving the problem itself.  Often, an elegantly simple analysis uncovers a problem that will be quite complex to solve.  These are two different issues.Â

In fact, I would go as far as to say the more complex the problem is to be solved, the more elegantly simple the analysis needs to be.  The reason is this: the most complex Marketing / Customer problems are usually cross-functional in nature, and to drive success in a cross-functional project, you need rock-simple analysis that galvanizes the team without a lot of second-guessing on the value of a successful outcome.

The bottom line for this slice of the problem: An analysis might be correct and even actionable, but too complex to be acted on.  Complexity opens the analysis up to (often accurate) disbelief in the conclusion, action never takes place, so insight is lost. The 3rd “too much data, no insight” problem is failure to translate a valid and easy to understand analysis into the correct action.  Here, we are finally moving out of the analytics side of the problem (delivering actionable analysis) and into the Business side.

Why is there failure to act correctly?  I’d submit to you it goes back to the Deconstruction of Marketing – most marketing folks simply don’t understand what to do with “people” as opposed to “Reach and Frequency”.  In other words, they can’t conceptualize how to act successfully against the individual or behavioral segment level as opposed to the nameless, faceless demographic level.Â

In my opinion, this is the primary reason why demographics are so overused in customer analysis, especially online – the marketing folks simply can’t get out of that box, i’s where the “actionability” starts for them.  The problem with this thought process, as has been pointed out, is that demographics often have little to do with behavior.  Behavior predicts behavior; demographics are mostly coincidental.  Yet the analyst, looking to produce a successful project, often will allow themselves to be dragged into endless demographic segmentation that is primarily a waste of time (unless you are a media site and sell demos) and leads to false conclusions, which lead to failed or inconsistent implementation.

The bottom line for this slice of the problem: the analysis identified a problem or opportunity, but in the end, the execution against the analysis was flawed and ultimately delivered poor or no real insight.  By the way, I think this third form of failure to deliver insight is the most common – much more common than most people think.  Why?  I’s the hidden one, the one that’s not so obvious and much easier to push under the table.

So there you have it.  Three versions of the “actionable analysis” problem that lead directly to the “so much data, but too little insight” issue.  I think #3 is probably the most prevalent; a lot of analysis “fails” not because of poor analysis, but poor execution against the analysis.

What do you think?  Have you delivered a clearly actionable analysis, one that is capable of real business impact, only to have the execution against the analysis botched?

Perhaps more importantly, were you able to do anything about the botched execution?  Were you able to turn it around?  How did you make that happen?

Or, is execution not really your problem – if Marketing (or whoever) screws it up, then they screw it up?