(This post is more or lessa narrative from my presentation at the 2007 Washington D.C. eMetrics / Marketing Optimization Summit)
“You know that campaign with the best response rate ever, the one with $5 million in sales? We lost over $1 million dollars on it, according to Finance. Something about the difference between Measuring Campaigns and Measuring Customers.”
– Me, giving my boss at HSN a piece of good news, 1991
That, my friends, was the first time I found out just how important control groups are to measuring the success of customer campaigns in an interactive, always on environment.
The Finance department – through the Business Intelligence unit – was measuring the net profitability of the campaign at the customer level. We (Marketing) were measuring the net profitability at the campaign level – based on response to the campaign. The difference was close to $3 million dollars – from a $1.9 million profit using Marketing’s campaign measurement to a nearly $1 million loss using Finance / BI’s customer measurement.
The crux of this difference is always on, self-service demand, or what Kevin calls Organic Demand. The only way to measure these customer demand effects accurately – and so the true profitability of campaigns- is with control groups. Online, this issue is primarily relevant to e-mail marketers (customer marketing) but comes into play in lots of different ways – especially so if you have PPC or display advertising taking credit for generating sales from existing customers.
Seems like there is a lot of confusion around what control groups are and why you should care about them, and I’m hoping this post helps to clear some of that up! But before I lose you in the details, here is why you should care about this topic:
1. Tactically: First and foremost,if you’re not using control groups, you are most likely chronically underestimating the sales / visits / whatever KPI you generate. “Response” is almost always lower than actual demand, because your campaigns generate sales / vists / whatever KPI you cannot track through campaign response mechanisms. Is full credit for what you contribute to the bottom line important to you? If so, stick around and read the rest of the post.
2.Strategically: In a multi-platform, multi-channel, multi-source world, control groups are the gold standard in customer campaign measurement. You will eventually be required to have a common success measurement that can be used for any situation, as opposed to success measurements “customized” for the quirks of every marketing situation that develops.
If you are not using controls, then your campaign results are always suspect. The fact nobody has asked you yet to prove the sales you claim to generate are actually generated by your campaigns is not an excuse; that day will come. Will you be ready? When “prove it” is on the table, the folks using control groups win over those who are not using them every time.
3.Culturally: The concept of “variance reporting” fundamental to the control group idea is very well understood by senior management. In fact, despite sounding complex, the control group idea is absolutely the easiest to explain to management and generates a tremendous level of confidence in what you are doing.
This is why confidence in controlled results is so high: there are no “caveats” and no need for specialized understanding from management of different channels or technologies. No explanations required for technological causes of error – why does this system say sales were this and this other system say sales were that? No doubts about the source of the ROI, no questions about external effects. Clean and simple, elegant in execution.
Interested? OK, here we go. Here is the idea in a nutshell.
Let’s talk a little about the idea of “incremental”, as in incremental sales or visits. Incremental means “extra beyond normal” or what is often called “lift” in the database marketing / BI world. The central issue is this: if I spend money on a campaign, I want the campaign to generate incremental sales beyond what I would get if I did not do the campaign. That’s logical, right? Why else spend the money, if the campaign is not going to lift my sales over and above what they would have been without the campaign?
In offline retail, Wall Street is always after one KPI – called the “comps”, short for “same store sales comparisons”. What they want to know is for stores open at least a year, what were the sales this quarter versus same quarter last year? That growth, or lift, is what determines how well the company is doing. The reason is simple: if they just look at gross demand, it can be inflated by opening new stores. These new store openings mask the true productivity of the operation, and Wall Street knows productivity is what drives profit growth in retail. So they want to know the incremental sales versus last year of a finite set of stores open at least a year – not the sales of all stores. In using this approach, they are controlling for the new store openings – removing the influence of them.
And that’s exactly what control groups are for – to remove the influence of any number of factors, and arrive at the true driver of the incremental change.
When testing the effectiveness of drugs, one of the control groups is often the placebo – the people who take a sugar pill instead of the real drug. This is done because of the placebo effect – the tendency of a person to feel better when they are taking a drug. Why is this done? Because the testers want to measure the real contribution of the drug – the incremental effects over and above the placebo effect.
OK? So here is how it works in customer marketing:
1. Choose a population to target with a campaign
2. Take out a random sample of that population to use as control – the “control group”. The remaining members of the population after the sample is taken out are called the “test group”.
3. Send the campaign to the test group, and do nothing to the control group. Measure the performance of the test versus control over time, and calculate the incremental impact on the test group of receiving the campaign.
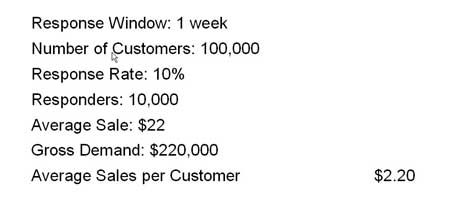
A typical email campaign to best customers might look something like this. Let’s say the campaign has an end date of 1 week after the drop; the customer has to react within a week to take advantage of the offer:

Respectable results for a best customer target – you do segment best customers out for different treatment, don’t you?
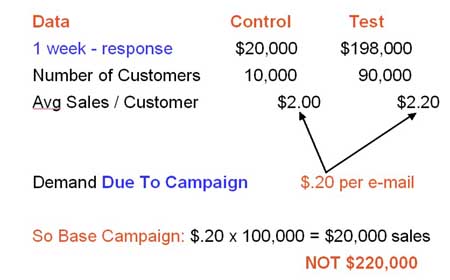
Here is what the same campaign probably looks like using a control group, after one week of response:

Note that 10% of targets were taken out as control; the remaining 90,000 received the campaign.
If this campaign had dropped to the entire population of 100,000, the campaign that generated $220,000 in sales really generated only $20,000 in sales, because the incremental sales impact of the campaign was only $20,000 ($.20 per e-mail) versus the control group who received no campaign. The other $200,000 would have been generated by this customer segment without the campaign. Follow?
Now at this point, you’re probably saying, “Hey Jim, I get it and all that but there’s no fricking way I’m going to implement this at my current job, I mean, I can’t take a hit like that in performance!”
To which I would say:
1. Don’t use controls until you change jobs – you’ll look like a major scientific testing hero at your next job!
2. You don’t have all the data to make this call yet…we need to talk about what I call “halo effects”.
Halo effects are generally the unintended actions taken by the targets of the campaign. At a basic level, it’s sales generated because of the campaign that you can’t track back to the campaignusing a “campaign response” methodology.
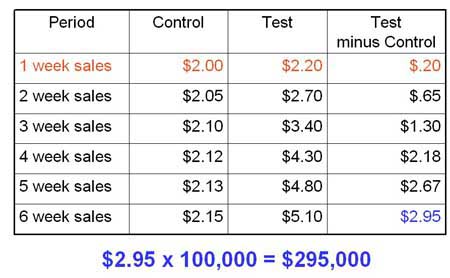
Here’s what this campaign looks like after 6 weeks, when probably almost all the the halo effects would be included. The numbers for each week are cumulative, they include the sales from the prior weeks:

Now that’s more like it! If this campaign dropped to the entire population (including the control), it would have generated $295,000.
In this case, there were $75,000 in sales over and above what a “response” measurement of $220,000 shows. These sales are coming primarily from people who did not respond to the campaign in a way you could track, but did respond to the campaign.
We’ll dive deeper into explaining how and why this happens, plus address some of the execution and cultural aspects of using control groups in the next post.
Until then, Questions, Comments, Clarifications?
First of all I would like to thank you for a very informative blog – not to mention your book!!
What I do wonder about though is how you would apply this in the case of a PPC campaign. You say: “Online, this issue is primarily relevant to e-mail marketers (customer marketing) but comes into play in lots of different ways – especially so if you have PPC or display advertising taking credit for generating sales from existing customers.”
I follow the general concept, but don’t quite understand how you technically would implement it for PPC or banner ads, as you can’t control whom of your existing customers are exposed to the ads, click through, buy etc. in the same way as one can with an e-mail campaign. So the concept of a predetermined control group would be pretty hard to follow up.
Of course this may be addressed by doing a time split test, but then other external factors would play in as well making the results less conclusive. You got a smart (and probably obvious :)) workaround or hack for a newbie?
Tony, thanks for the comment / question.
Success on this particular task really depends on how well your measurement infrastructure is put together. I could create a control group and not drop any e-mail to that control. Then I could see what kind of sales activity I get in the control, understanding what I am really measuring is “all other media plus self-service”.
You will get the net contribution of e-mail, and be able to fully claim that share versus whatever all the other sources like PPC are claiming. So you’ve answered the question not by measuring any other media using a control, but by specifically measuring the contribution of e-mail versus all other media as a group.
From there, it gets less “rigorous”, as you pointed out. If I have a customer database that tracks source of all sales, and assuming my source tracking works pretty well, I can begin to understand the components of this “everything else” demand – how much is PPC, how much banners, how much is self-service – by killing off campaigns. This last piece of business is not controlled in a scientific sense but there are some tricks you can play to simulate control – using public service ads in a split test / rotation, for example.
Frankly, I’m kind of surprised with all the “optimization” Google is up to that they don’t provide an easy facility for creating control groups in a PPC campaign. I’m pretty sure we would learn some interesting stuff in the organic versus paid area. Perhaps when they integrate DoubleClick…
Hi Jim,
I’ve been guilty of being too busy to comment on the “framework for engagement” post that you made recently though I always meant to return to it. Firstly I have to say I agree with the idea entirely. What’s more I have a direct marketing background and completely understand the control group concept. I am one of those technical guys that learned marketing. :) I used to work in a direct mail firm which sent millions of letters daily and would routinely use control groups to determine what the best marketing messages were in mailouts.
I just have never been able to implement and prove that control groups work with the clients I work with in the online space due to too many of the cultural problems which exist (the companies I work with don’t have a CAO or even an analytics and research Hub – though I am working to change that). I got extremely interested with your six weeks analysis above. What mechanisms did you put in place to track the test minus controls in the PPC and email examples?
You’re talking my language. When I was talking about REAN I was talking about visualizing and planning mechanisms for the customer lifecycle. A tactic that helps folks understand what it is that they’re trying to measure both on and offline. Once you have planned you then build KPIs which include the Nurture phase which is primarily the whole thing you’re discussing.
What your work is doing is showing that this can really work. I am now really starting to understand where you’re coming from having browsed through a number of your posts tonight. Lightbulbs coming on over here.
You use customer control groups to measure activity across channel. When you discuss customer you mean someone that is in your database as having bought something (or if you like registered, or downloaded). In many of the recent engagement discussions I think customers have been defined as visits etc.
Does your book go into more depth around this subject? If so I’ll take a copy, this is the best stuff I’ve read in a very long time.
Best regards
Steve
Steve – did you get a chance to read this post:
http://blog.jimnovo.com/2008/02/08/marketers-both-ways/
This is the paradox that folks who do not use control groups have to answer for. What percentage of the sales would have happened anyway? If that number is zero, then interactivity is *not different*, and there is no point in thinking about customer experience and all the rest of it; customers only buy when you pound them with marketing – just like offline.
But that’s simply not true. Once they agree to that concept, the idea that sales to current customers might occur without any marketing at all, the next step is control groups, to find out what that percentage is.
I did read the marketers both ways post.
I bought the book (Drilling Down) by the way and look forward to see how it can add to my current perspectives on things.
Thanks, and let me know if you have any questions!
If anything, the book presents these ideas in a much more logical, serial format than you’ll be exposed to reading posts on a blog…
The book should provide you with a complete toolkit for measuring and managing the Nurture phase in REAN, as well as insight into how activity in other phases affects what will happen in Nurture.
what about for receipt marketing campaigns where no control group is taken? and the redemption offer was valid only for a particular day?
how can i come up with incremental sales?
Nice post on need for control. Any books you could recommend which would give more details about this incremental lift and so ….
Any thoughts on double differencing ? i.e
|pre period – post period|
|test – control|
A-B-C-D
Thanks
Deepak
Deepak, don’t think there are any books on this subject alone. It’s really pretty simple math, and perhaps because of this, it seems like there should be a lot more to the story? But there isn’t – did the test outperform control. That’s it. More on some implications of this type of measurement here:
http://blog.jimnovo.com/2007/12/11/control-groups-2/
Re: double differencing, I try to use the most precise measurement technique I can given the situation. Sometimes you can’t get a control, particularly for acquisition. So repeated pre period – post period testing is really all you can do, and it you can repeat the results each time, then you get a pattern. The more times it repeats, the more confident you can be the results are “true”.
This is also the answer to shehsawar. “Control” becomes sales normally occurred on that day of that month, and was there lift? Repeat the experiment until you are confident there is an actual effect.
Try to do these experiments when no other marketing programs are running, or in a single market so you can compare to other markets to remove bias (a problem control groups takes care of).
Example: you have 2 markets or 2 stores. Do the promotion for market / store #1 and not for market / store #2.
For the day of the promotion, you find that for #2 (control), sales for the day were up 2% versus same day last week / month / year. For #1 (test), sales were up 5% versus same day last week / month / year.
This means promotion generated 5% – 2% = 3% or 60% of the 5% lift. The other 2% / 40% of lift was from other factors (product, promotion, seasonal).