Category Archives: Lab Store

Relationship Marketing Economics

Just opened up a carton from a manufacturer we use in the Lab Store.  Every unit inside looks like this:

Bad nozzle

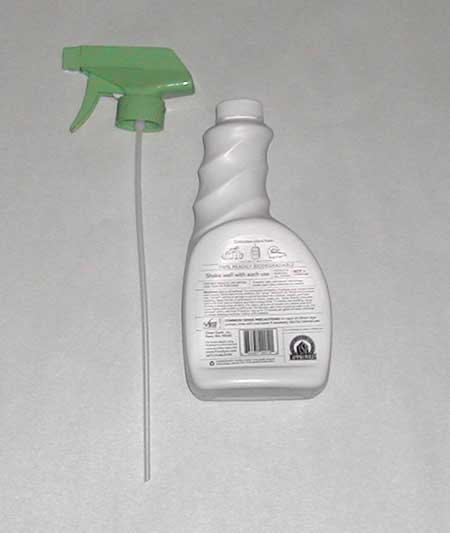
Here’s your challenge:

Would anybody in your business recognize this as a problem?  Or would they just shrug and transfer the item to the picking racks?

In other words, finding this, would you or an employee:

1.  Ship to the customer as is, let the customer figure it out

2.  Cut the nozzle off so customer doesn’t have to even think about it, doesn’t have to send you e-mail or call asking about it

Your answer to this question depends on:

1.  How customer-centric you / your org really is

2.  How much you understand about the financials of your business

Continue reading Relationship Marketing Economics

Lab Store: Year End Analysis

Some stats from the Lab Store (Background) for the year:

Processed 10,172 orders, up 3% from last year, despite a logistical problem in the business model we did not have control over (breeding of animals).  Fixed that, so should not be an issue going forward.  Merchandise Return Rate of .3% on dollars, which is quite low.

Returns cost money to process, imply negative Social feedback, and increase customer defection by creating poor experience.  We do everything we can up front to keep returns and other negative experiences from happening in the first place by screening products and actually taking action on customer feedback and analysis.  Often, we modify packaging, create our own instructions, or assemble products we know people will have trouble with.  More on this idea here: Marketing through Operations and Panic Pack!.

We retained between 75% – 87% of our best buyers depending on what time frame you use, and further improvement in these stats is pending test results.  More on this idea here: Frequent Buyer Analysis.

Continue reading Lab Store: Year End Analysis

Lab Store: Frequent Buyer Analysis

Every year just before the holiday season we take a look at the customer database for the Lab Store – the online retail biz my wife runs – and see what’s up with 10x or more buyers.

I often prefer to look at “worst case” data when doing customer analysis; this way you don’t over-estimate the Potential Value of the business going forward.  The beginning of the 4th Quarter is a good time to do this since “holiday” really hasn’t kicked in yet, so you don’t have those buying influences skewing the natural activity in the customer database.

At the end of September, we took a look at all customers, no matter when they became customers,  who have purchased from us at least 10 times - a best customer analysis.  Considering a “year” to be 9/30 to 9/29,  we bucketed them by when their last purchase was – past year, 2 years ago, 3 years ago, 4 or more years ago (the business started 5 years ago).

Here are the results:

Last purchase date was in               Percentage of all 10x or more Buyers

9/30/07 -  9/29/08                                 75%

9/30/06 -  9/29/07                                 12%

9/30/05 -  9/29/06                                   8%

9/30/04 -  9/29/05                                   5%

If this data is still confusing, the second line above would read, “Of all customers who have ever bought 10x or more, 12% last purchased in the period 9/30/06 -  9/29/07.

Continue reading Lab Store: Frequent Buyer Analysis