Monthly Archives: February 2007

I’m at Training 2007 (the Conference)

Yea, I know, kind of weird.  What the heck is a Marketing / Web Analytics guy doing at this event?

The Training Conference and Expo is the largest conference of training professionals in the US.  It’s the first conference I have been to in 10 years that I’m not speaking at.  Probably the first conference I have been to in 20 years where just about everybody knows more about the topic than I do. 

And I have to tell you, that’s incredibly refreshing. 

I’m thinking I have to do this more often!  After all, what exactly is the point of going to conferences on material you already have deep knowledge of?  Unless it is to present, of course…

I’m here on behalf of the Web Analytics Association scouting out vendors to administer the Certification test we are developing for web analysts, and to learn everything I can about best practices in Certification.  One of the challenges is we are looking to certify folks not on “software” related issues like implementation / set-up (the vendors do a fine job here) but on the business side, where the issues are often not as quantifiable as they are in software land.  So we need a vendor that can work with us on a more flexible testing methodology than many are used to.  If you have any suggestions / advice on certification test vendors, let me know.  There are 9 vendors here.

Here are some interesting things I have learned so far:

1.  Virtually none of these Training / HR folks have ever heard of web analytics before.  They have no idea what the heck I am talking about, or that web analytics people even exist from an HR perspective.  The typical response is “we could have used somebody like that when we were setting up our Intranet … what is their typical job title and who do they report to?”

 2.  The primary model used in training course development is called ADDIE.  It stands for:

Analyze
Design
Develop
Implement
Evaluate

which is a formal sequence of tasks where “Evaluate” has an arrow looping back up to the top pointing to Analyze, meaning you repeat the sequence and there is a continuous improvement process.  Hmm, that sounds kind of familiar, where have I seen this before?  Perhaps filed under Best Practices for web site development?

3.  Lots of the communication and behavioral models used in Marketing are used in Training – Training is in many ways a specialized kind of Marketing.  I initially thought I was dead wrong about this but when I put forth the idea, nobody threw me out of the room or called me a Newbie.  So I think there is something worth exploring about this parallel, especially since e-Learning delivered through web interfaces is a big deal to these folks.

More to come as the event unfolds…
More Trouble for Unique Visitors

I’m minding my own business and McAfee wants to “Update”.  I think this is a simple update of the virus database and even though I am very busy doing something else, I go for the update.  So of course, without warning, I am treated to a monster update of the entire McAfee program, complete with all kinds of FUD links that lead to very poorly executed landing pages.  Terrible customer experience, and that’s what I was going to post about.  But since everybody probably sees the same thing all the time, I think the following sequence will be much more interesting.

Being a web analytics freak, about 30 minutes after the install, I checked out the way the new McAfee program handles cookies.  You guessed it:

(click on any of these images for bigger pic)

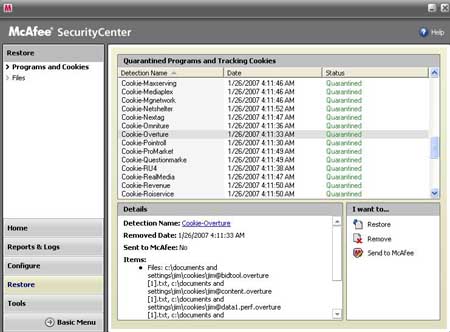
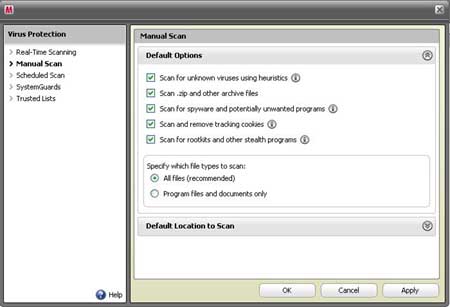
“Scan and remove tracking cookies” is automatically activated on install.  Then I go into the “Quarantine” section and here is what I find:

All my “tracking cookies” have been Quarantined.  Certainly looks like all the major ad-serving networks are represented, and what looks to be a bunch of Overture conversion cookies.

This cookie crunching doesn’t mean much to me because I don’t build any very important (KPI level) metrics using “Unique Visitors” as a base.  For one thing, I was doing web analytics before cookies were pervasive and I’m comfortable using “Visits” or “Sessions” as a base (Sales per Visit, for example, as opposed to Sales per Unique Visitor).  The other reason is that you simply cannot get an accurate Unique Visitor count, meaning there’s a lot of “noise” in the number.  I don’t like basing key performance metrics on a noisy base number, it’s asking for trouble.  And it appears this cookie situation will be getting worse over time – worse than it already is with all the anti-spyware scrubbing of cookies, the firewall problems, and so forth.

Yet I know a lot of people base everything they do on Unique Visitors because it “makes more sense to management” and it’s “more logical” and so forth.  Fine.  Here’s what is going to happen.  The cookie block / erase / quarantine problem is going to artificially increase the number of Unique Visitors you are getting to the site.  You’re not getting more, it will just look like you are due to loss of tracking at the Unique level.  This means Sales per Unique Visitor, for example, will start falling over time even though in reality, based on actual Unique Visitors (which you can’t measure) it may be staying the same or rising.

My advice to you is to start shadow tracking now using Visits or Sessions as the base in your most important metrics, the ones you are on the hook for.  You don’t have to show them to anybody, just keep track of them in Excel or something and note the trends.  Then when you start seeing your Unique Visitor based metrics collapsing on you, you can whip out the Visit / Session based metrics and say, “See!  See!  It’s really not happening!  We’re doing much better than you think!”

Makes more sense to management, indeed.  Until you try to explain why Management should now believe your Visit-based metrics instead of the Unique Visitor based metrics.  Good luck on that one.

(Note to Ron: This subject makes me very Cranky, could you tell?)

Customer Accounting: How to Speak Finance

Let’s say you have decided to build a relationship with the CFO or a peer in Finance.  How do you get started?  Here are two report concepts and charts that will give you much more to talk about than you can squeeze into one lunch.  By taking Finance’s own numbers (Periodic Accounting) and recasting them into the numbers that matter for Marketing (Customer Accounting) you create a very solid bridge and basis for building out a plan.  Note to yourself: And the plan is?  Make sure you think about that first…how can you help Finance / the Company achieve their Cash Flow and other Financial goals?

Report 1: Sales by Customer Volume

Core Concept: The idea here is to decompose a CFO’s financial quarter (or any financial period) into the good, better, best customer volume components that make up the financial period.  It’s a “contribution by customer value segment” idea.  Benefit: Graphically demonstrates to the CFO the “risk” component of customer value in the customer portfolio and supports the idea Marketing could mitigate financial risk by “not treating all customers in the same way”.

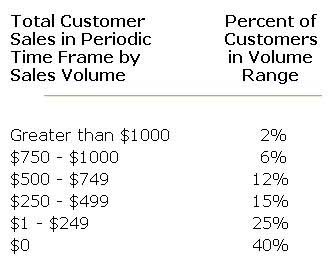
Take any periodic statement time frame – a month, a quarter, a year.  Gather all the customer revenue transactions for this period, and recast them into the total sales by customer for the period.  Decide on some total sales ranges appropriate to your business, and produce a chart on the percentage of customers with sales in each range, including non-buying customers, for the chosen periodic accounting time frame.  For example:

 By Volume

Run this report each period, and compare with prior periods.  In general, you want to see the percentage of customers contributing high sales per period to grow over time, and the percentage of lower revenue customers to shrink.  This means you are increasing the value of customers overall.  If the numbers are moving the other way, this is the type of customer value problem you would expect CRM or a smart retention program to correct, and if you are successful, you should see the shift in customer value through this report.

Report 2:  Sales by Customer Longevity

Core Concept: This report is a “Flashcard”, if you will, that demonstrates the Customer LifeCycle.  If you have trouble communicating complex LifeCycle / LifeTime Value concepts to Financial people, this Flashcard takes their own numbers and decomposes them into a vivid picture of why the LifeCycle matters.  Benefit: Opens the door for your budgets to be determined by different metrics than are currently used; what good is a “quarterly budget” when the underlying customer issue can be much more dynamic?  Wouldn’t the CFO like you to “do what it takes” in the Current Period to preserve profits in Future Periods?

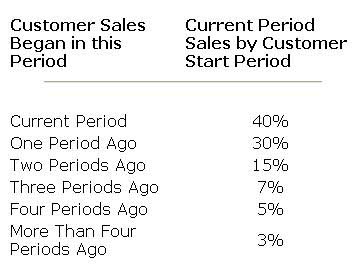
Take any periodic statement time frame – a month, a quarter, a year.  Gather all the customer revenue transactions for this period, and recast them relative to the start date of the customer.  In other words, when looking at the revenue generated for the period, how much of it was generated by customers who were also newly started customers in the same time period?  How much was generated by customers who became new customers in the prior period?  How about two, three, and four periods ago?  More than 4 periods ago?  Depending on the length of the period you use, you may end up with a chart looking something like this:

LifeCycle

You can run this analysis at the end of each period and track the movement of customer value in your customer base.  Generally, you want to see increasing contribution to revenue from customers in older periods, meaning you are retaining customers for longer periods of time and growing their value.

If this kind of idea interests you, the full background on explaining the LifeCycle / LTV to Finance is here.