Tag Archives: Marketing thru Operations

Using Multiple, Related Customer Models Across the LifeCycle

Jim answers questions from fellow Drillers
(More questions with answers here, Work Overview here, Index of concepts here)

Topic Overview

Hi again folks, Jim Novo here.

So you have all these simple but powerful customer models – Recency alone, Latency,  RFM, or LifeCycle Grids – how do you know which one (or ones) are best to use for your business? Guess what – it depends on the specific features of your business and also how you run the business. Now, while that might sound a bit scary, it’s really not that big a deal and in the end, the great news is you’ll end up with an approach customized to your business. So how do you accomplish this? Just segment and analyze your customers; they will tell you, my fellow Driller, which direction is the best to follow. You dig? Let’s go ahead and see what that looks like …


Q:  We recently purchased your book

A:  Thanks for that!

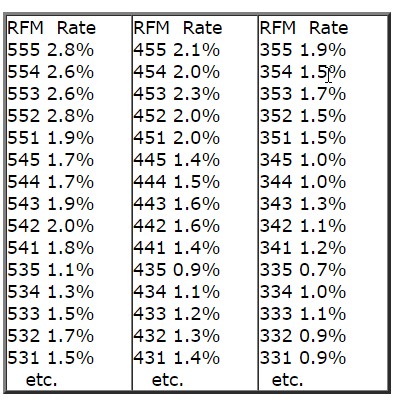
Q: and we are ready to start building some RFM analysis.  We are a search marketing business – we have a large customer /prospect base.  We have limited knowledge about them and we are keen to start on the journey.

A:  OK…let’s see what you’ve got.

Q:  We are hoping to extract database (approximately 25k names) of the last 6 months records and do some RFM analysis on key customer groups.   Specifically:

TEST GROUP A – people who initially purchased one of our trial products – we want to know what is their RFM score.

TEST GROUP B – subscribers to our “tool kit” product at $50 / month – we want to know what is their RFM score.

Q:  What kind of data are we talking about?  Is it web site visits, clicks on emails, transactional / subscription data, all of the above?

A:  Before setting up the model we have a couple of questions we hope you can shed some light on:

1.  How do we treat subscription – our business has a mix of one-off and subscription business – if someone “buys” every month with a subscription, is that included in Recency & Frequency?  Any insight you can provide us would be great – we found some info on this in the book but unsure given ours is a mix of subscription and one off.

Continue reading Using Multiple, Related Customer Models Across the LifeCycle

Segment to Best Determine LifeTime Value (LTV)

Jim answers questions from fellow Drillers
(More questions with answers here, Work Overview here, Index of concepts here)

Topic Overview

Hi again folks, Jim Novo here.

LTV has to be actionable.  If  you can’t take action on the information, it’s not relevant anyway.

There you go, the most universally true rule when attempting calculation of LTV.

And the best / easiest way to accomplish this is to identify similar customer behaviors and segment the customers by these behaviors – THEN figure out LTV by segment.

If you can’t actually take action on the information, then why spend countless $$ and hours fussing over all the reasons the number you come up with might be wrong and trying to solve unsolveable data or corporate issues? The best idea to implement when developing / using LTV is consistency – let’s get the team to agree on what LTV is and how to measure it, stick with those ideas for at least several years, test and take action on the results to uncover value, THEN (perhaps) discuss improvements!


Q:  I have just been reading your series on Comparing the Potential Value of Customer Groups. I am having trouble calculating the lifetime value of our customers.

A:  Yes, well, everybody does for some reason!  Often the problem is too much
focus on trying to look at the “average customer” as opposed to segmenting
customers.  By segmenting first, it’s both easier to get to LTV *and* more useful since it’s easier to take action on  a segment than the “average customer”.

Q:  Our company provide accounting software solutions to small to medium sized owner operated  businesses.  Because of what we sell and who we sell to, a lot of our customers are most likely to just buy one or two of our software products and unless they sign up for support (only around 15% do), we may never here from them again.  It is therefore very difficult to determine an average / standard lifetime that customers use our product.

A:  Sure.  First, the 15% segment that does sign up for support sound like good customers to me.  So that’s one segment.  How long do they typically stay signed up?  That’s the average life for this segment.

Then there are probably people who upgrade over time, right?  I can’t imagine an accounting product that people would not upgrade – perhaps not every cycle, but every 2nd or 3rd cycle.  That’s another segment.  Then there are probably some who both follow the upgrade cycle and pay for support.  These are probably the “best customers” and they are a unique segment as well.

And finally, you have the buyer who makes one purchase and you never see again.  These people are also a segment.

Q:  What should I base it on, how long our customers use our products (which would be almost impossible to determine), or how long they spend money with us?  So I measure on average the time between the first and last transaction of customers who have the highest Recency???

Continue reading Segment to Best Determine LifeTime Value (LTV)

Modeling Defections – When is a Customer No Longer a Customer?

Jim answers questions from fellow Drillers
(More questions with answers here, Work Overview here, Index of concepts here)

Topic Overview

Hi again folks, Jim Novo here.

Metrics are not usually also Models; the metrics have to be fine-tuned / combined and built up into models. And executing this process usually depends alot on what type of business is being analyzed, and what kind of problem is targeted for a solution. So while it’s pretty simple to define a metric, creating a version of the metric that specifically addresses the challenge at hand can be a bit more difficult. Not hard, mind you; it mostly just takes a decent understanding of how the business works. Want some examples? Read on, O Fellow Driller …


Q:  Is Latency, as a metric, out of the question when the spread of the number of days in a latency period is so wide that to average them out and call the resultant figure “Acceptable days to date of predicted purchase” would seem meaningless?  I am thinking about the disparity in latency between customers who are Heavy, Moderate and Low users.

A:  I’m not sure I have enough context to understand the question (what are you trying to accomplish by using the metric?) but Latency is what it is.  In other words, you take your clue from the existing behavior itself.  If the average Latency for a certain segment is 2 years, well, it is, and that’s not too long or too short, it just is.  Whether you can act on that information is another story; it depends on what you are trying to accomplish.

For example, average Latency on major home appliances, depending on brand, is anywhere from 5 to 10 years.  Is that too long of a “spread” to make the metric useful?  No.  It just is what it is, and you deal with it. Typically these ideas are used to reallocate marketing spend away from waste on unresponsive segments towards segments that will generate incremental profits.

Continue reading Modeling Defections – When is a Customer No Longer a Customer?