Category Archives: Web Analytics

Tortured Data – and Analysts

Fear and Loathing in WA

You may recall I wrote last year about the explicit or implicit pressure put on Analysts to “torture the data” into analysis with a favorable outcome.  In a piece called Analyze, Not Justify, I described how by my count, about 50% or so of the analysts in a large conference room admitted to receiving this kind of pressure at one time or another.

Since then, I have been on somewhat of a personal mission to try to unearth more about this situation.  And it seems like the problem is getting worse, not better.

I have a theory about why this situation might be worsening.

Companies that were early to adopt web analytics were likely to already have a proper analytical culture.  You can’t put pressure on an analyst to torture data  in a company with this kind of culture – the analyst simply will not sit still for it.  The incident will be reported to senior management, and the source of “pressure” fired.  That’s all there is to it.

However, what we could be seeing now is this: as #measure adoption expands, we find the tools in more companies lacking a proper analytical culture, so the incidents of pressure to torture begin to expand.  And not just pressure to torture, but pressure to conceal, as I heard from several web analysts recently.
Continue reading Tortured Data – and Analysts

Control Groups in Small Populations

Jim answers more questions from fellow Drillers

Want to see additional questions & answers from fellow Drillers?

Here’s the blog archive; the pre-blog email newsletter archives are here.

Q: Thank you for your recent article about Control Groups.  Our organization launched an online distance learning program this past August, and I’ve just completed some student behavior analysis for this past semester.

Using weekly RF-Scores based on Recently and Frequently they’ve logged in to courses within the previous three weeks, I’m able to assess their “Risk Level”– how likely they are to stop using the program.  We had a percentage who discontinued the program, but in retrospect, their login behavior and changes in their login behavior gave strong indication they were having trouble before they completely stopped using it.

A: Fantastic!  I have spoken with numerous online educators about this application of Recency – Frequency modeling, as well online research subscriptions, a similar behavioral model.  All reported great results predicting student / subscriber defection rates.

Q: I’m preparing to propose a program for the upcoming semester where we contact students by email and / or phone when their login behavior gives indication that they’re having trouble.  My hope is that by proactively contacting these students, we can resolve issues or provide assistance before things escalate to the point they defect completely.

A: Absolutely, the yield (% students / revenue retained) on a project like this should be excellent.  Plus, you will end up learning a lot about “why”, which will lead to better executions of the “potential dropout” program the more you test it.

Continue reading Control Groups in Small Populations

Acting on Buyer Engagement

Over the years I’ve argued that there is a single, easy to track metric for buyer engagement – Recency.  Though you can develop really complex models for purchase likelihood, just knowing “weeks since last purchase” gets you a long way to understanding how to optimize Marketing and Service programs for profit.

Which brings me to the latest Marketing Science article I have reviewed for the Web Analytics Association, Dynamic Customer Management and the Value of One-to-One Marketing, where the researchers find “customized promotions yield large increases in revenue and profits relative to uniform promotion policies”.  And what variable is most effective when customizing promotions?

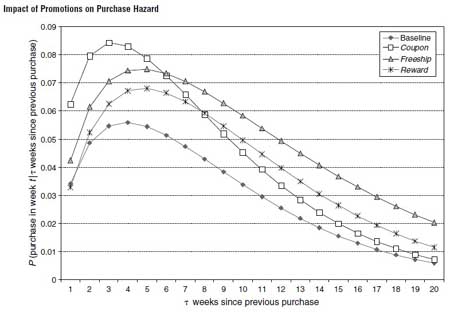
The researchers took 56 weeks of purchase behavior from an online store, and used the first 50 weeks to construct a predictive model of purchase behavior.   Inputs to the model included Price, presence of Banner Ads, 3 types of promotions, order sizes, number of orders, merchandise category, demographics, and weeks since last purchase (Recency).

The last 6 weeks of data were used to test the predictive power of the model, and the answer to which variable is most predictive of purchase is displayed in the chart below, click to enlarge:

Weeks since last purchase dominated the predictive power of the model, controlling not only the Natural purchase rate (labeled Baseline in chart above, people who received no promotions) but the response to all three different types of promotion.

Continue reading Acting on Buyer Engagement