Category Archives: Measuring Engagement

Acting on Buyer Engagement

Over the years I’ve argued that there is a single, easy to track metric for buyer engagement – Recency.  Though you can develop really complex models for purchase likelihood, just knowing “weeks since last purchase” gets you a long way to understanding how to optimize Marketing and Service programs for profit.

Which brings me to the latest Marketing Science article I have reviewed for the Web Analytics Association, Dynamic Customer Management and the Value of One-to-One Marketing, where the researchers find “customized promotions yield large increases in revenue and profits relative to uniform promotion policies”.  And what variable is most effective when customizing promotions?

The researchers took 56 weeks of purchase behavior from an online store, and used the first 50 weeks to construct a predictive model of purchase behavior.   Inputs to the model included Price, presence of Banner Ads, 3 types of promotions, order sizes, number of orders, merchandise category, demographics, and weeks since last purchase (Recency).

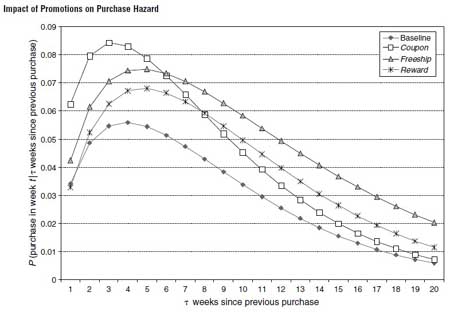
The last 6 weeks of data were used to test the predictive power of the model, and the answer to which variable is most predictive of purchase is displayed in the chart below, click to enlarge:

Weeks since last purchase dominated the predictive power of the model, controlling not only the Natural purchase rate (labeled Baseline in chart above, people who received no promotions) but the response to all three different types of promotion.

Continue reading Acting on Buyer Engagement

Relational vs. Transactional

Jim answers questions from fellow Drillers
(More questions with answers here, Work Overview here, Index of concepts here)


Q: I am hoping you can help answer a question for our team. By way of introduction, I am the CEO of XXXX. We are a specialty retailer / restaurant of gourmet pizza, salads and sandwiches. We would like to know restaurant industry averages (pizza industry if possible) for customer retention – What percentage of customers that have ordered once from a particular restaurant order from them a second time?  I am hoping with your years of expertise and harnessing data you may be able to assist us with this question. Look forward to hearing from you.

A:  Unfortunately, in those said years of experience, I have found little hard information on customer retention rates in QSR and restaurants in general (if anyone has data, please leave in Comments).  It’s just the nature of the business that little hard data, if collected, is stored in such a way that one can aggregate at the customer level. The high percentage of cash transactions doesn’t help matters much; there’s a lot of data missing.

Over the years, sometimes you see data leak out for tests of loyalty programs, and of course clients sometimes have anecdotal or survey data, but this isnot much help in getting to a “true” retention rate. More often than not you discover serious biases in the way the data was collected so at best, you have a biased view of a narrow segment. Often what you get is a notion of retention among best customers, or customers willing to sign up for a loyalty card, but not all customers. And the large “middle” group of customers is where all the Marketing leverage is.

What to do about this predicament?

There are really two issues in your question; the idea of using industry benchmarks when analyzing customer performance, and the measurement of retention in restaurants.

Continue reading Relational vs. Transactional

RFM versus LifeCycle Grids

Jim answers questions from fellow Drillers
(More questions with answers here, Work Overview here, Index of concepts here)


Q: First of all, thank you for the excellent book! I’m really excited about digging into our own customer data to see what we’ll learn.

A: Thank you for the kind words!

Q: However, when you’re creating the RF Scores, what is the standard timeframe you should use? I have access to about 5 years worth of purchase data – should I create RF scores based on the last 5 years, 3 years, 2 years, 6 months?

Our sales are quite cyclical, so I think the baseline should probably be at least a year, and I’m considering doing two years. It seems as though if I get too much larger than that, my results will be too watered down.

I’m also planning on generating “historical” RF scores by filtering my data to reflect the purchases only up to a certain point. So, to generate a Q1-09 score, I’d create it from sales data of Q1-07 through Q1-09. The Q2-09 score would be from Q2-07 through Q2-09, etc. Does this make sense? It will allow us to see the changes that have been happening in our company even though we’re only just now looking at the data. It will give me a picture of what it would have looked like, had I looked at it back then.

A:  I think you have accurately understood the situation and have the right approach! This type of analysis is very sensitive to time frame.

There are really 2 broad types of customer analysis. There is analysis for action in the present, a Tactical approach driving towards a “we should do this now” result, and the more Strategic analysis, which is informational and says “this is what we should have done then” and / or “this is why we should make these business changes”. The shorter time frame is Tactical, the longer timeframe Strategic.

Continue reading RFM versus LifeCycle Grids