Category Archives: Customer Experience

Segmentation by LTD & LifeCycle

Jim answers questions from fellow Drillers
(More questions with answers here, Work Overview here, Index of concepts here)


Q: One of the first things I am doing in my new job is to identify the Customer Lifecycle pattern – how many periods (month, year) will it be before a customer is likely buy again.  In enterprise software industry, where software cost easily 6 figures, # of years is a reasonable time frame.

A: Yes, one would assume this.  But these notions would most likely be based on a feeling of the “average” behavior, and on average, it probably does take a long time.

What is not known is this:  if the “average” is composed of short-cycle and long-cycle buyers, who are the short cycle buyers, and what are they like?  What industry SIC code, for example?  And can we get more of them, or at least focus more resources on them, if they are the most profitable?  So the challenge is not only to look for the “average”, but then understand how this average is composed.  If you can break down the average by industry, or by salesperson, for example, this might be highly directional information.

Q: From my internal analysis, however, I discerned from the sales figures something quite counterintuitive – the period between first and next sale is much shorter than I would have thought for the SW industry in general.

Continue reading Segmentation by LTD & LifeCycle
LTV, RFM, LifeCycles – the Framework

Jim answers questions from fellow Drillers
(More questions with answers here, Work Overview here, Index of concepts here)


Q: I visited your website because I am trying to understand how to develop a customer LifeTime Value model for the company that I work at.  The reason is we are looking at LTV as a way to standardize the ROI measurement of different customer programs.

Not all of these programs are Marketing, some are Service, and some could be considered “Operations”.  But they all touch the customer, so we were thinking changes in customer value might be a common way to measure and compare the success of these programs.

A: Absolutely!  I just answered a question very much like this the other day, it’s great that people are becoming interested in customer value as the cross-enterprise common denominator for understanding success in any customer program!

If I am the CEO, I control dollars I can invest. How do I decide where budget is best invested if every silo uses different metrics to prove success?  And even worse, different metrics for success within the same silo?

By establishing changes in customer value as the platform for all customer-related programs to be measured against, everyone is on an equal footing and can “fight” fairly for their share of the budget (or testing?) pie.  By using controlled testing, customers can be exposed to different treatments and lift in value can be compared on an apples to apples basis – even if you are comparing the effect of a Marketing Campaign to changes in the Service Center.

Continue reading LTV, RFM, LifeCycles – the Framework

Acting on Buyer Engagement

Over the years I’ve argued that there is a single, easy to track metric for buyer engagement – Recency.  Though you can develop really complex models for purchase likelihood, just knowing “weeks since last purchase” gets you a long way to understanding how to optimize Marketing and Service programs for profit.

Which brings me to the latest Marketing Science article I have reviewed for the Web Analytics Association, Dynamic Customer Management and the Value of One-to-One Marketing, where the researchers find “customized promotions yield large increases in revenue and profits relative to uniform promotion policies”.  And what variable is most effective when customizing promotions?

The researchers took 56 weeks of purchase behavior from an online store, and used the first 50 weeks to construct a predictive model of purchase behavior.   Inputs to the model included Price, presence of Banner Ads, 3 types of promotions, order sizes, number of orders, merchandise category, demographics, and weeks since last purchase (Recency).

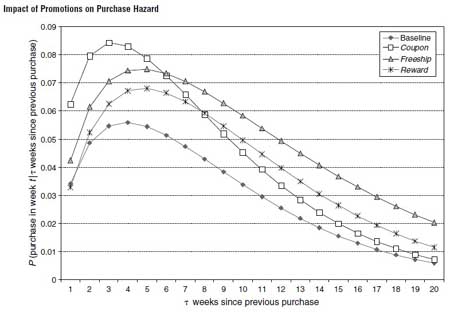
The last 6 weeks of data were used to test the predictive power of the model, and the answer to which variable is most predictive of purchase is displayed in the chart below, click to enlarge:

Weeks since last purchase dominated the predictive power of the model, controlling not only the Natural purchase rate (labeled Baseline in chart above, people who received no promotions) but the response to all three different types of promotion.

Continue reading Acting on Buyer Engagement