Category Archives: Analytical Culture

“Scrap Learning”

New phrase I’d never heard before: “Scrap Learning” is training that is delivered to students that goes unused.  For example, employees sign up for training that has nothing to do with their job just to get out of working, or are forced into this situation by some misdirected “mandate”.  Or they are forced to take a course so far ahead of when they will need the knowledge they forget this knowledge by the time an on-the-job use opportunity rolls around. 

Apparently this is a pretty big problem in large companies and wastes millions of dollars in Training budgets every year.  Reducing / Eliminating Scrap Learning is one way to optimize Training budgets for maximum ROI; if you can get rid of Scrap Learning, you spend a lot less money and get virtually the same impact.  Kind of like segmentation in Database Marketing, right? 

Some estimates of Scrap Learning run as high as 50% of all Training delivered.  One of the easiest ways to reduce Scrap Learning is to simply trigger an e-mail to the employee’s supervisor and get confirmation the employee who signed themselves up really needs to take the course.  Hmmm…

Here’s the problem.  The success of many Training departments is measured by “volume” metrics like the total number of student hours consumed.  If that is your success metric, do you have any incentive to reduce Scrap Learning?

Just got back from the Training 2007 conference.  All sorts of stuff like the above is whizzing around in my head.  The “experts” say one way to drive Creativity is to Learn material outside your own knowledge domain, then try to connect this knowledge back to your own domain.  I have that going on in a big way…

Fear of Analytics is a huge problem in HR / Training; I’m beginning to think this is a pervasive problem across the entire enterprise.  We know this is a culture problem, but the question is, what is the right model for evaluating, addressing, and fixing this problem?  The issue has been addressed here and there for specific applications, but as far as I can tell, not in any kind of comprehensive way.  What can we do about Scrap Learning?  Scrap Marketing?  Scrap Sales?  Scrap Service?

And then, think about what this looks like from a cross-silo view, the Inter-departmental Scrap, the Scrap created because there are not clear metrics channels calibrated so the success metrics of one department do not conflict with the success metrics of another department.

Brother, that’s a lot of Scrap.  Are your metrics aligned with your mission?  Or are you incented to produce a lot of Scrap?
Customer Accounting: How to Speak Finance

Let’s say you have decided to build a relationship with the CFO or a peer in Finance.  How do you get started?  Here are two report concepts and charts that will give you much more to talk about than you can squeeze into one lunch.  By taking Finance’s own numbers (Periodic Accounting) and recasting them into the numbers that matter for Marketing (Customer Accounting) you create a very solid bridge and basis for building out a plan.  Note to yourself: And the plan is?  Make sure you think about that first…how can you help Finance / the Company achieve their Cash Flow and other Financial goals?

Report 1: Sales by Customer Volume

Core Concept: The idea here is to decompose a CFO’s financial quarter (or any financial period) into the good, better, best customer volume components that make up the financial period.  It’s a “contribution by customer value segment” idea.  Benefit: Graphically demonstrates to the CFO the “risk” component of customer value in the customer portfolio and supports the idea Marketing could mitigate financial risk by “not treating all customers in the same way”.

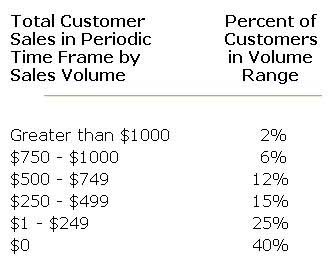
Take any periodic statement time frame – a month, a quarter, a year.  Gather all the customer revenue transactions for this period, and recast them into the total sales by customer for the period.  Decide on some total sales ranges appropriate to your business, and produce a chart on the percentage of customers with sales in each range, including non-buying customers, for the chosen periodic accounting time frame.  For example:

 By Volume

Run this report each period, and compare with prior periods.  In general, you want to see the percentage of customers contributing high sales per period to grow over time, and the percentage of lower revenue customers to shrink.  This means you are increasing the value of customers overall.  If the numbers are moving the other way, this is the type of customer value problem you would expect CRM or a smart retention program to correct, and if you are successful, you should see the shift in customer value through this report.

Report 2:  Sales by Customer Longevity

Core Concept: This report is a “Flashcard”, if you will, that demonstrates the Customer LifeCycle.  If you have trouble communicating complex LifeCycle / LifeTime Value concepts to Financial people, this Flashcard takes their own numbers and decomposes them into a vivid picture of why the LifeCycle matters.  Benefit: Opens the door for your budgets to be determined by different metrics than are currently used; what good is a “quarterly budget” when the underlying customer issue can be much more dynamic?  Wouldn’t the CFO like you to “do what it takes” in the Current Period to preserve profits in Future Periods?

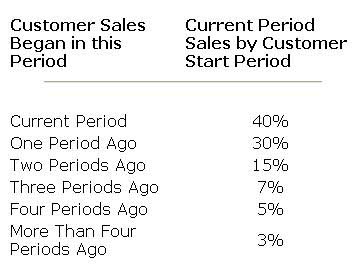
Take any periodic statement time frame – a month, a quarter, a year.  Gather all the customer revenue transactions for this period, and recast them relative to the start date of the customer.  In other words, when looking at the revenue generated for the period, how much of it was generated by customers who were also newly started customers in the same time period?  How much was generated by customers who became new customers in the prior period?  How about two, three, and four periods ago?  More than 4 periods ago?  Depending on the length of the period you use, you may end up with a chart looking something like this:

LifeCycle

You can run this analysis at the end of each period and track the movement of customer value in your customer base.  Generally, you want to see increasing contribution to revenue from customers in older periods, meaning you are retaining customers for longer periods of time and growing their value.

If this kind of idea interests you, the full background on explaining the LifeCycle / LTV to Finance is here.

Reporting versus Analysis: The “Actionable” Debate

Gary Angel and Eric Peterson have been having a great exchange surrounding the definition of KPI’s, and more specifically, the requirement that they be actionable.   Gary started out with the position the “criteria of actionability is unsound in almost every way” but I think both he and Eric have resolved in the middle somewhere – it’s really about context.  Gary is right, to take any metric “naked” at face value without surrounding context is simply not good analytical practice.  But I would argue (and I think Eric agrees) that to build a KPI in the first place, you must already have the required context, or you don’t have a KPI.  So that leaves us with “how you define a KPI” as (I think) the final resting point, and there really isn’t anywhere to go after that.  Your comments on my analysis welcome.

However, I think the ideas Gary has exposed run deeper than just the KPI discussion.  The situation Gary is addressing – making sure people really understand that every metric requires business context to be functional – requires attention because web analytics is a very fast growing field with a lot of brand new people in it who may have not been exposed to proper analytical training. Or, not challenged to do any real analysis by weak managers.

These new people frequently don’t understand the difference between Reporting and Analysis.  A “Reporting” mentality (provide data) leads to the improper use of analytical ideas like KPI.  Analysis (provide insight) would automatically take into account a lot of other factors, as Gary has suggested.  Knowing all those factors (because you are doing real analysis), you can certainly take movements in a KPI as actionable.  As Eric says, that “action” is often a more focused analysis of some kind.  KPI’s are really just “tripwires” that alert you to a problem or opportunity that requires further analysis.

My concern (and in the end, I think Gary’s) is that often the Reporting mentality is Robotic and that the reaction taken to change in a KPI might be equally Robotic if you don’t have the proper context.  What often happens in Pay-per-Click testing is a great example of this, and a lot of the multivariate stuff people are now addicted to is an extreme example. 

You can look at conversion rates, make changes to landing pages, and try to optimize the “Scenario”.  This is Reporting, not Analysis.  Can you provide insight into why the changes you made worked?  For example, can you explain the improvement in terms of Psychology or Consumer Behavior?  Usability?  If so, that would be Analysis, and the answers would be applicable to a wide range of other challenges on the site.  Without knowing why the changes worked, you are left with simple Reporting that applies to only a single specific Scenario.  Nothing was really learned here.

Take this same idea to the extreme, and you get what often happens in multivariate testing.  You can certainly run a multivariate test on 5 variables at the same time, and find a “winning combination”, but this is Reporting, not Analysis – in fact, it’s black-box reporting in the extreme.  For example, how do you know that you chose the 5 most important variables to optimize?  How do you know the options you chose for each variable are the most powerful?  Isn’t it just as likely that the final optimization you achieved is suboptimal, a local maximum, as it is the solution is truly optimal? 

In other words, isn’t it possible that what you have created with the robot is better than you had, but is not even close to being the best it can be?

Dear Reader, you’re asking, why should I care about this Reporting versus Analysis issue?  Because here is what will happen without real Analysis: you are going to “hit the wall”.  One day, there will simply be nothing left you can do to improve on what you have done.  Reporting is only going to take you so far.  Frustrated, you will probably Analyze the situation and realize you have “optimized” yourself into a corner by taking something that was fundamentally broken in the first place and making it better than it was.  You can’t make it any better unless you wipe it out and start again.  That’s a huge waste of resources, right?

See CRM if you need an example of what can happen when you automate worst practices.  And they’re going to fix it 8 years later by bolting on Business Intelligence?  Um, shouldn’t the Analysis have come first?